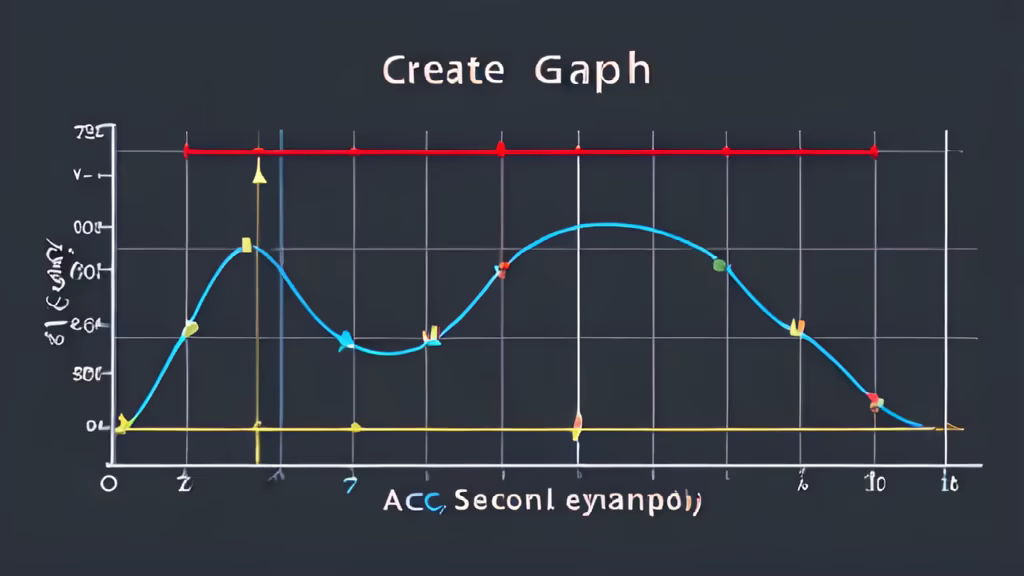


Prompt: create a 2 line graphs in a single chart where the first graph is slightly above the seccond graph and the randomly add some flat lines the graph should also look like matplotlib was used and the title is \"acc vs v-acc\" x_labels = [0, 20, 40, 60, 80, 100, 120, 140] y_labels = [0, 0.65, 0.70, 0.75, 0.80, 0.85, 0.90]