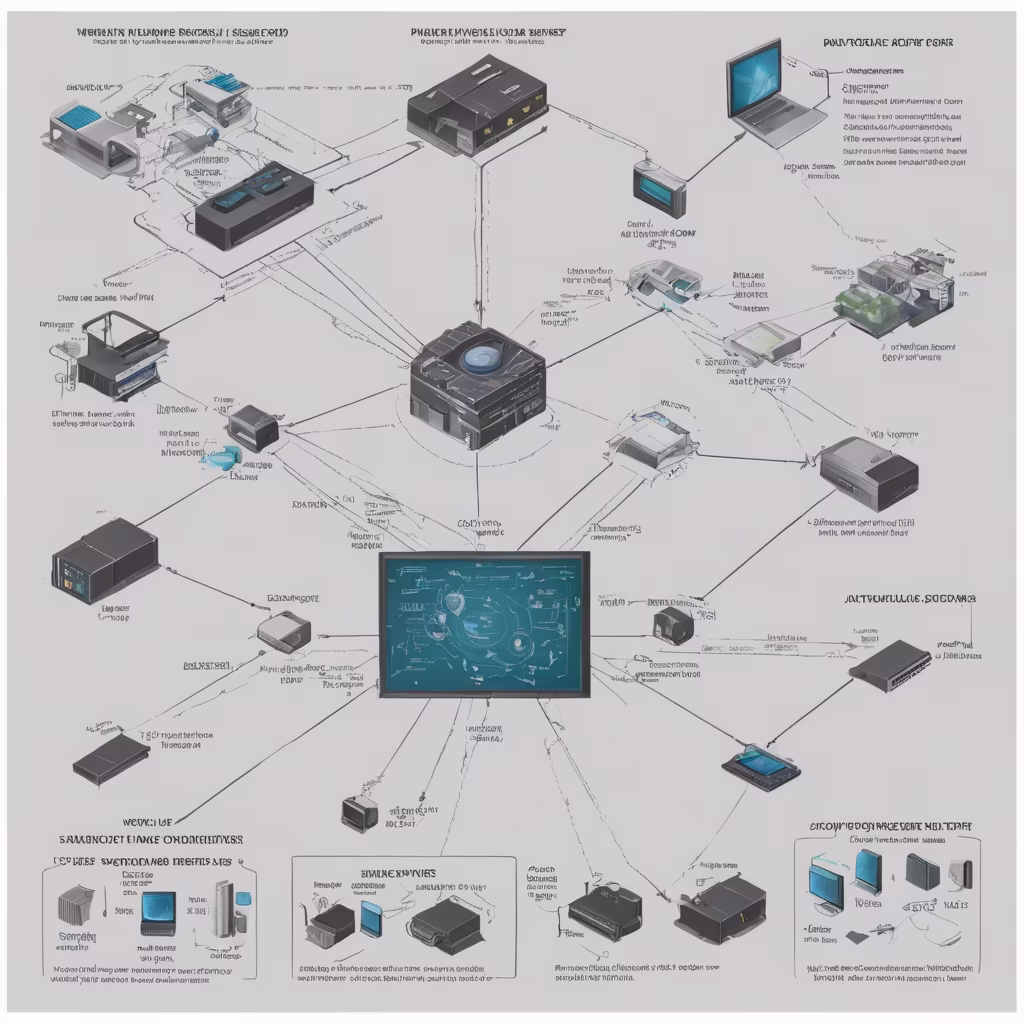
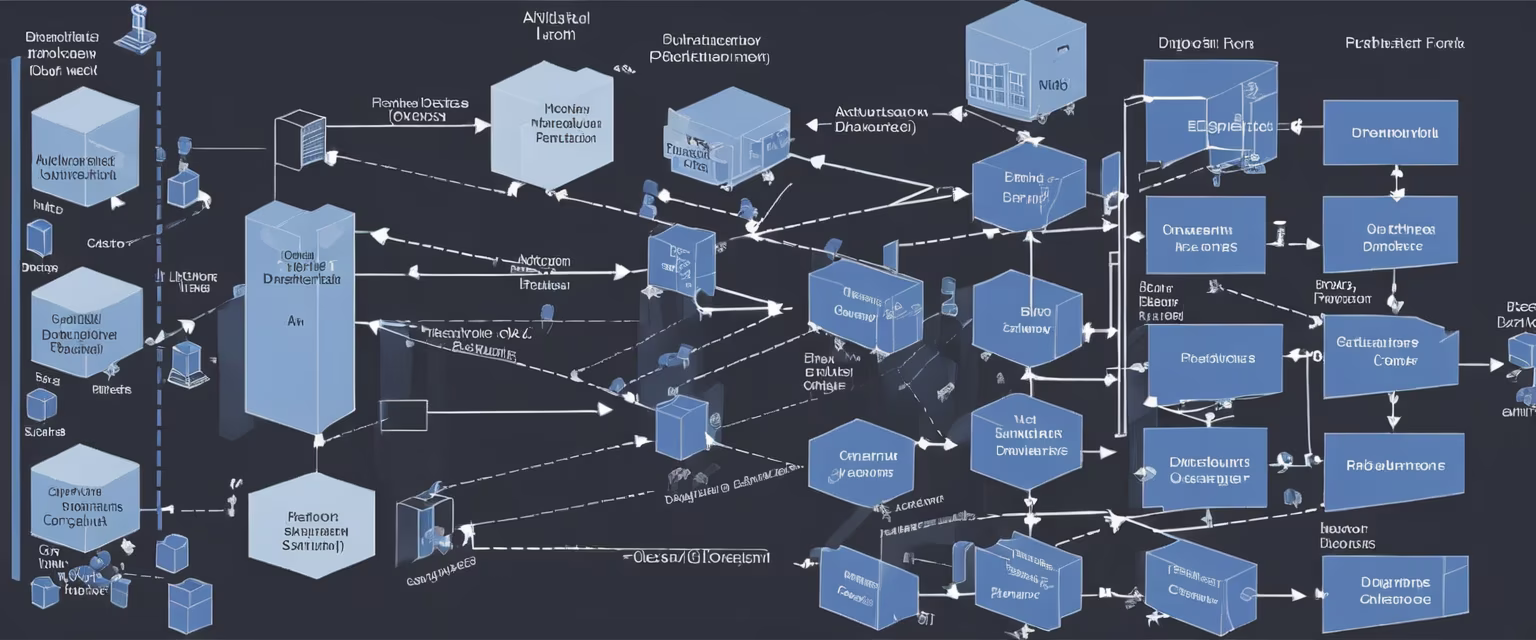
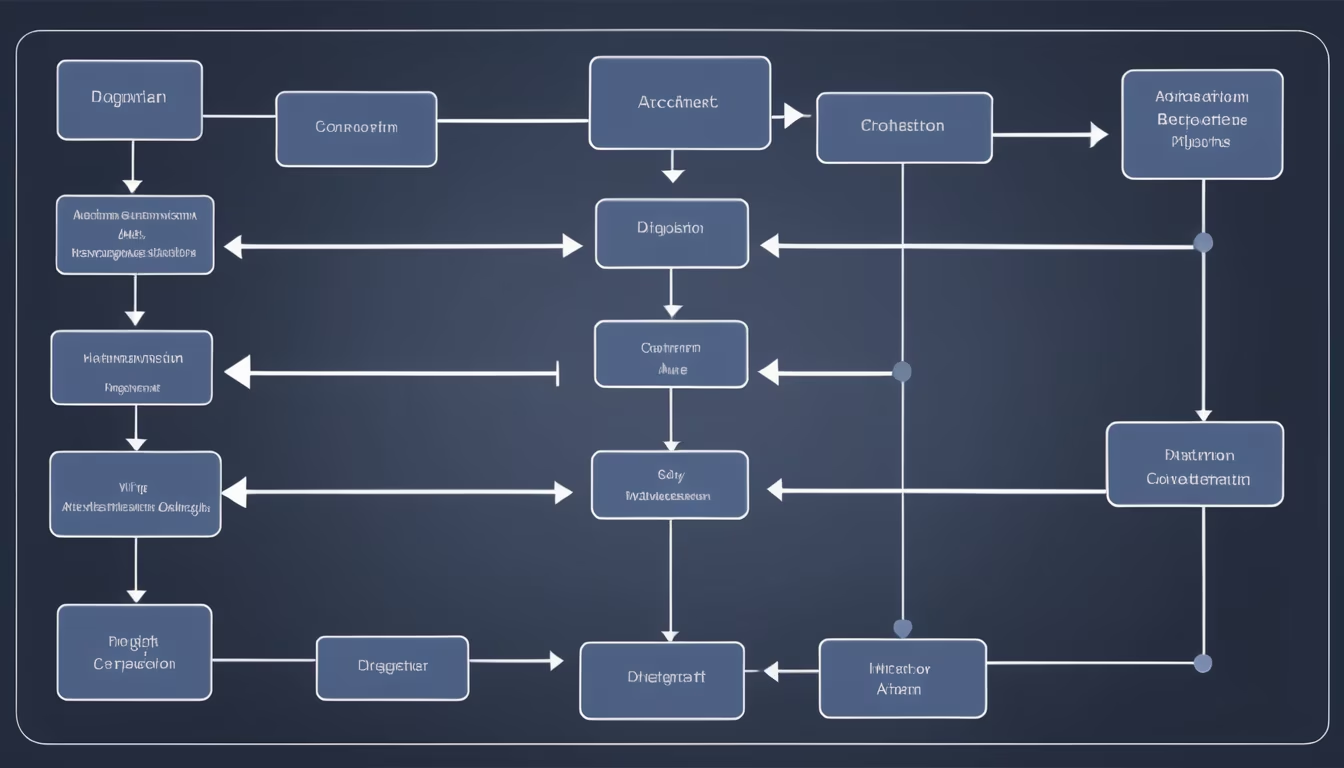
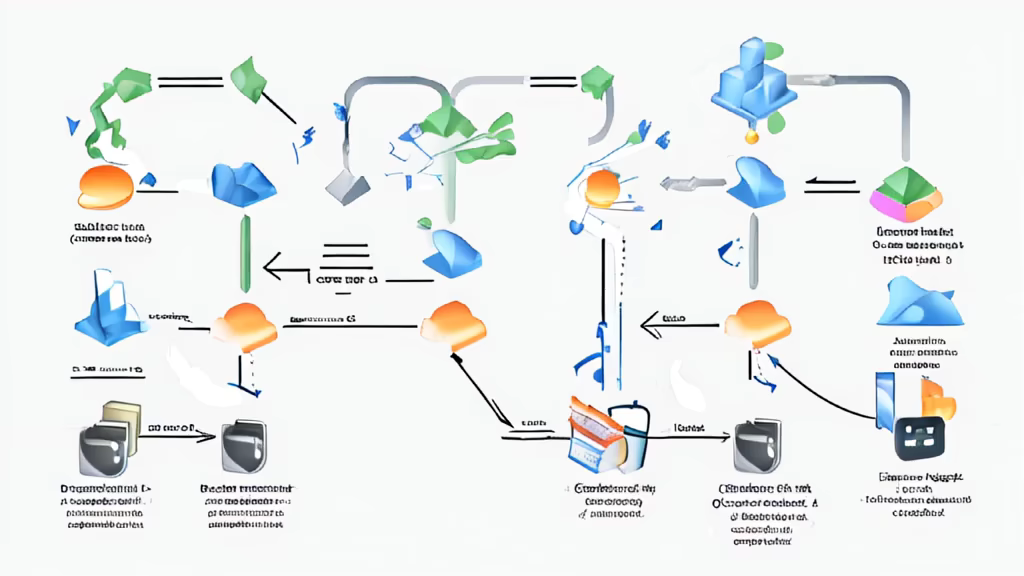
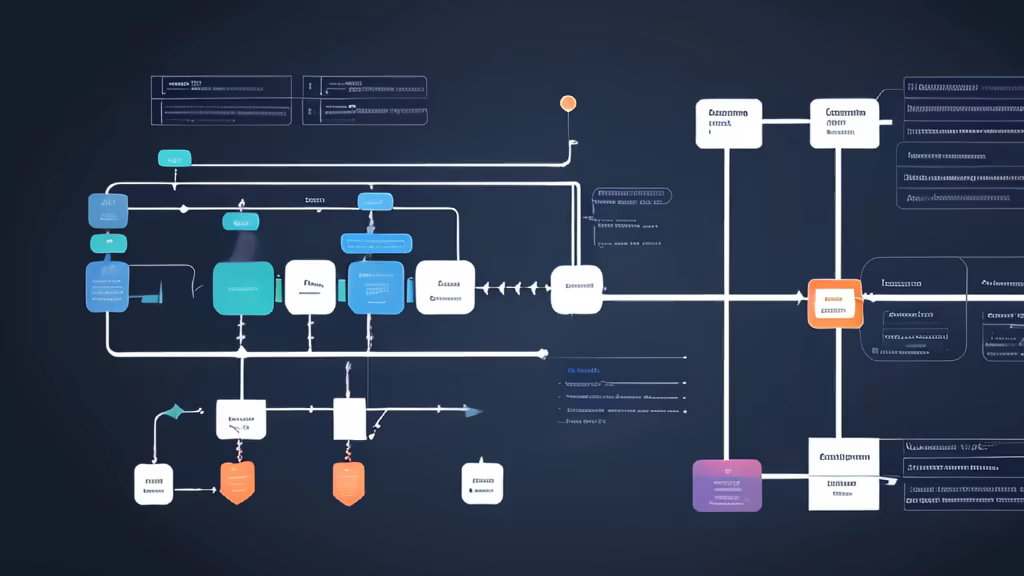
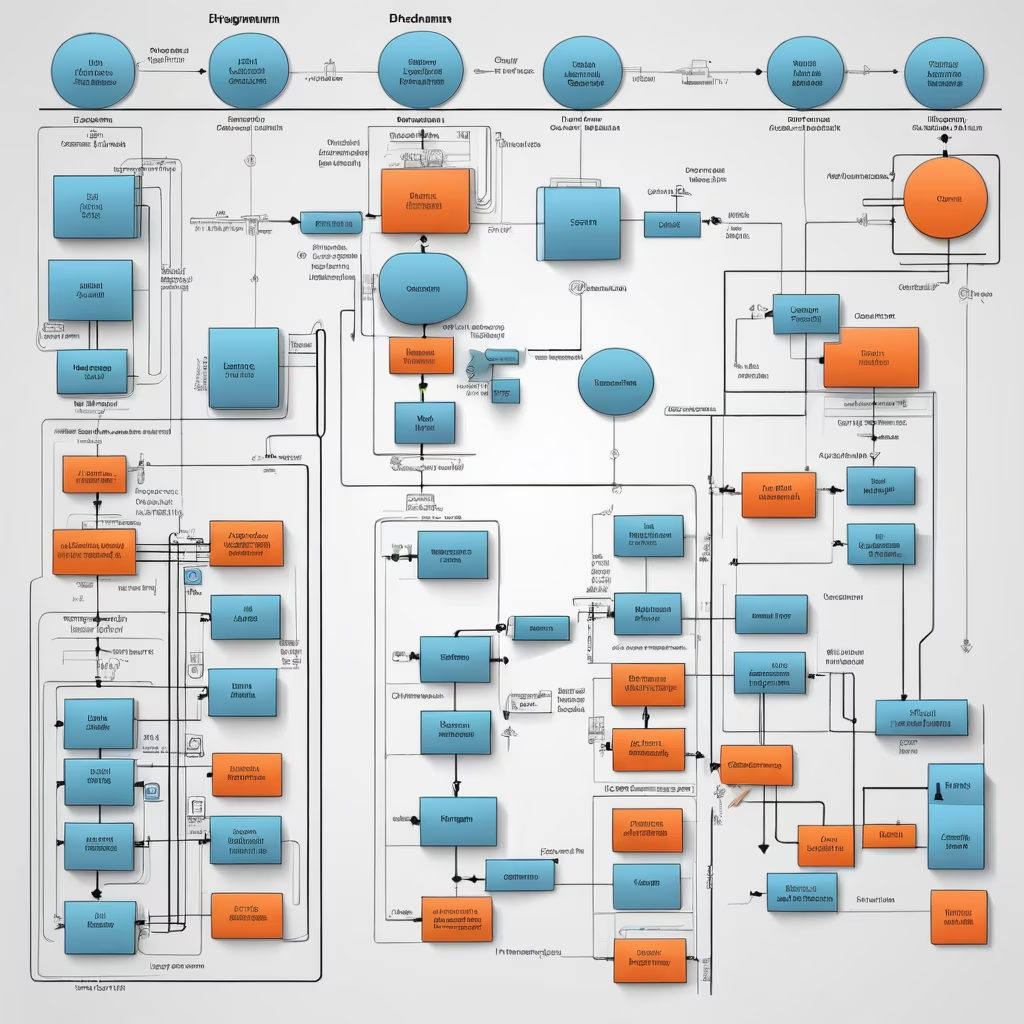
Prompt: A software architecture, the front end has multiple widgets that surface some user information; each widget is connected with one or multiple backend Microservices using an API gateway. Each microservice is connected to a NoSQL database. Consider five widgets in total. 2d, drawing of software architecture


Prompt: Draws a webpage first, the web page has five widgets, label each of them as 1, 2, 3, 4 and 5. Connect each widget with another box each, label them as micro service, add one icon of API gateway on each of these micro service boxes. Connect each micro service with a NoSQL database icon and label them as database. Draw this as a software architecture diagram, 2d, consider all icons are AWS icons.


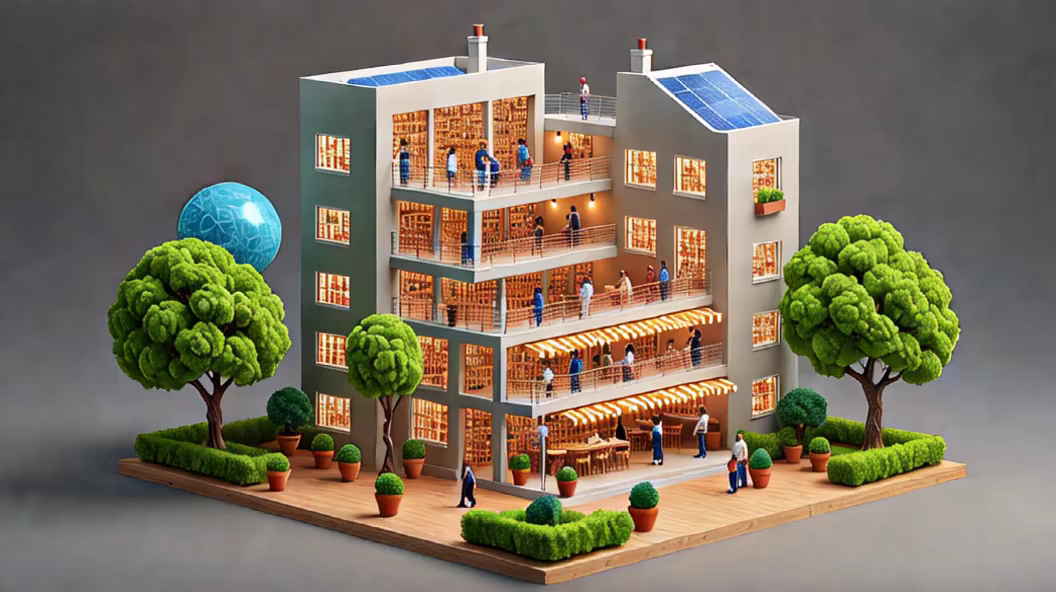


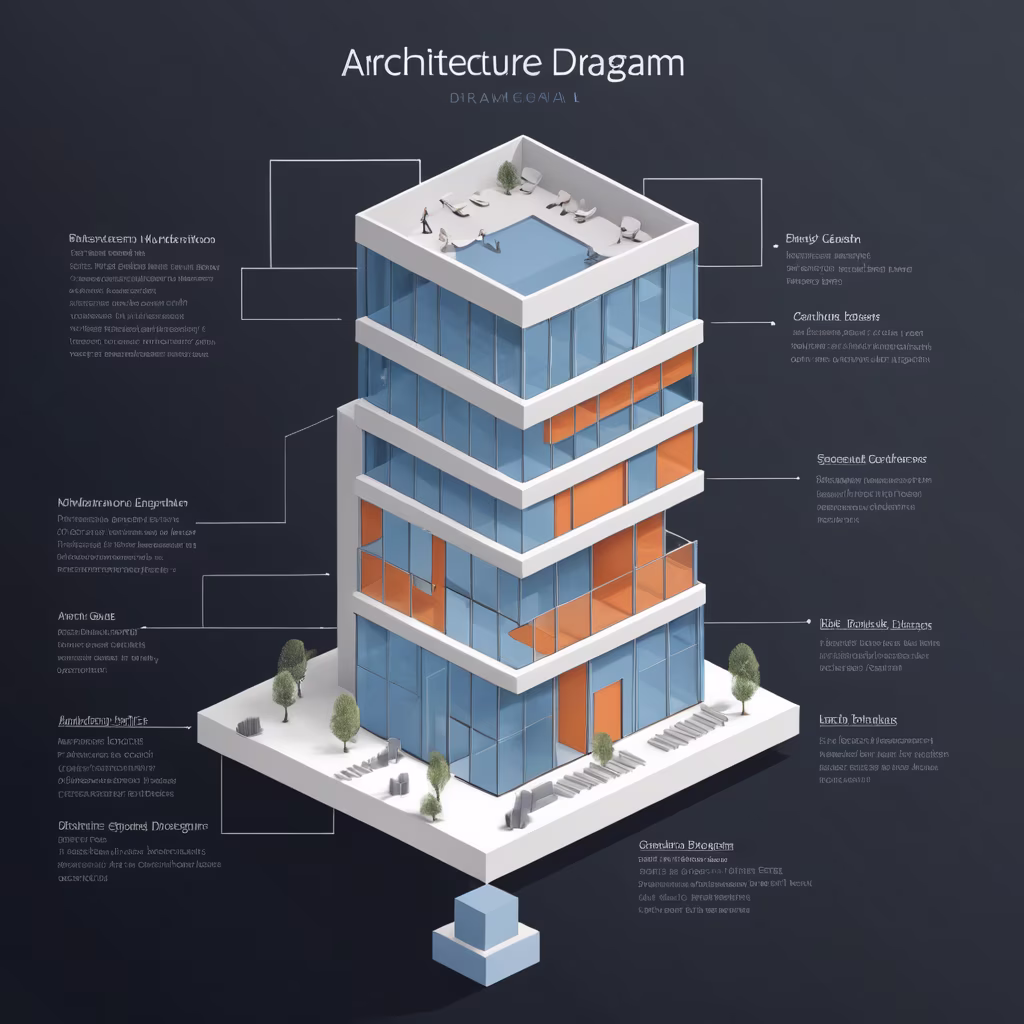


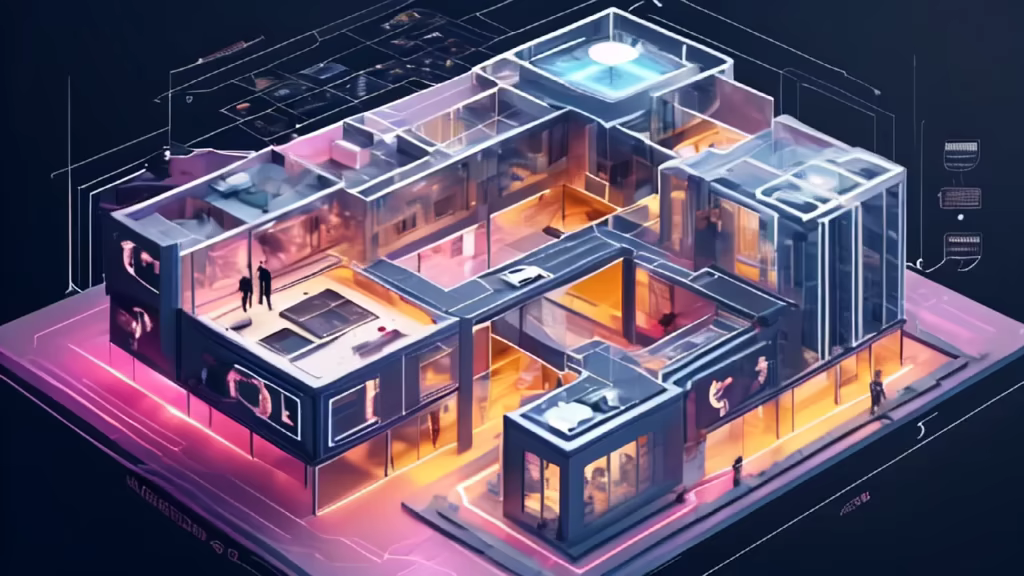
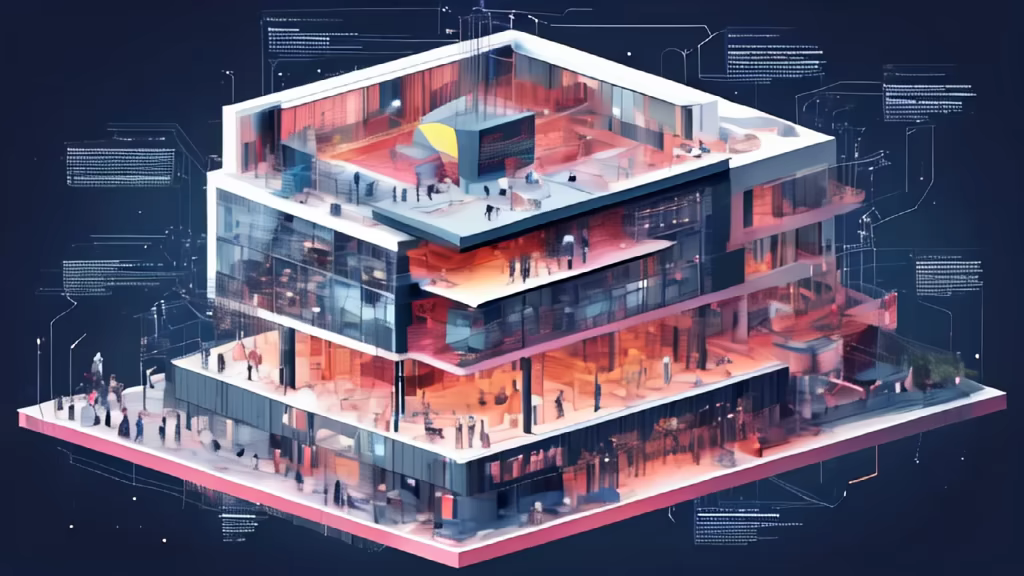
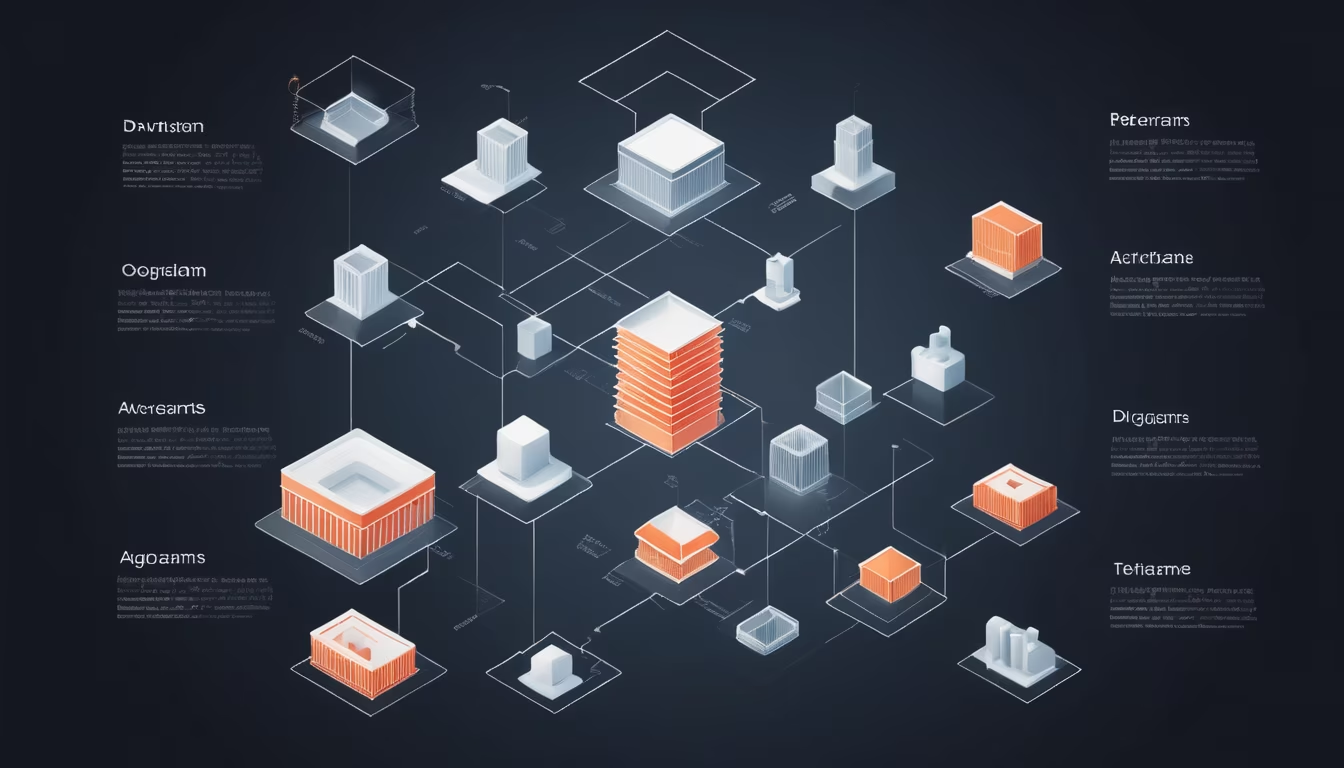
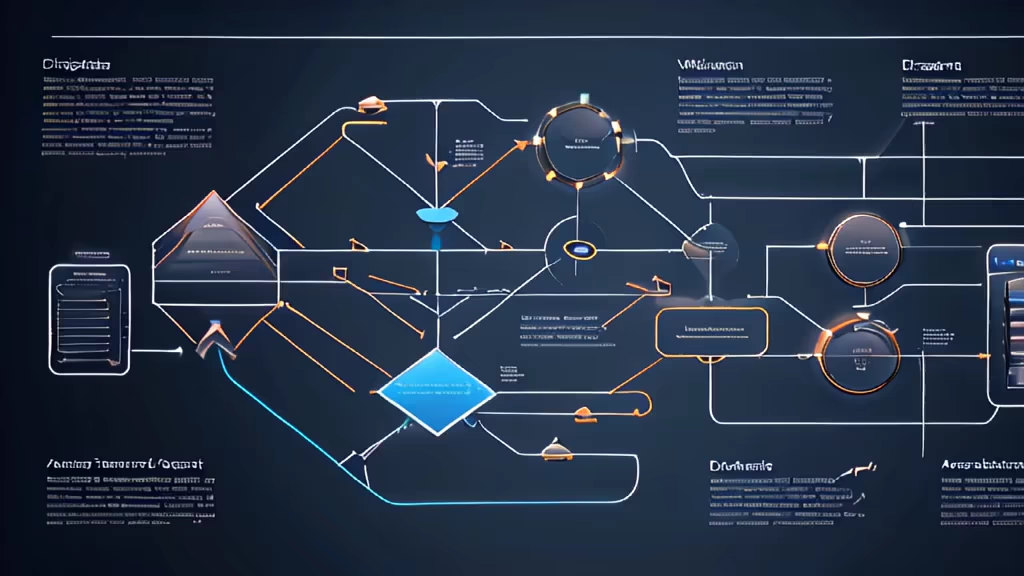
Prompt: To harness the power of artificial intelligence (AI) in generating an architectural diagram, one must first comprehend the essence of AI and technology. AI refers to the simulation of human intelligence in machines, enabling them to analyze data, learn from patterns, and make informed decisions. Technology, on the other hand, encompasses the tools and processes that facilitate the application of scientific knowledge for practical purposes. Combining AI and technology in the realm of architecture produces an innovative fusion—AI art buildings. This entails leveraging AI algorithms to envision and craft architectural designs, infusing structures with a harmonious blend of computational precision and creative ingenuity. Through this symbiosis, architects can unlock novel possibilities, allowing for the creation of visually captivating and conceptually advanced architectural diagrams that push the boundaries of traditional design methodologies.


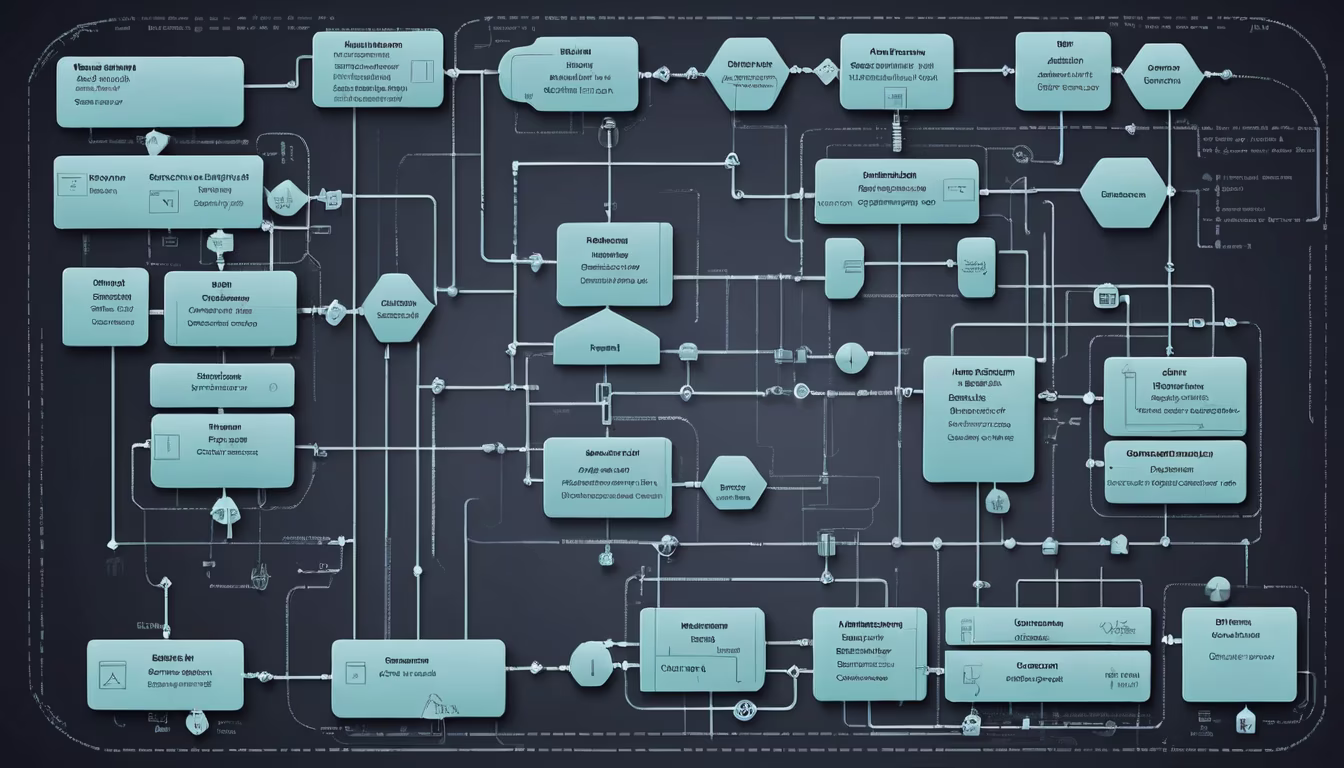
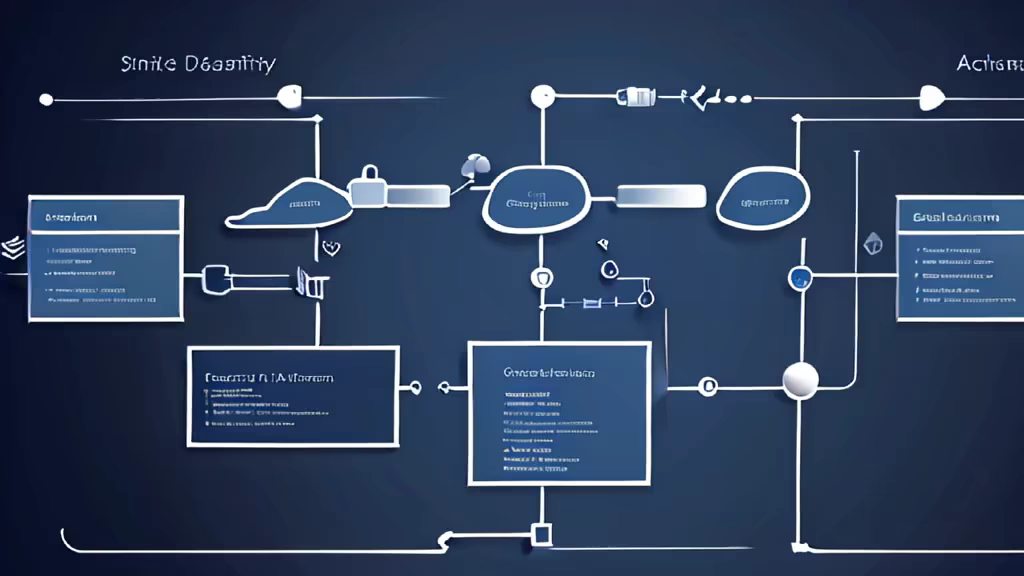
Prompt: Visualize a sleek, minimalist flowchart, its nodes and connections representing the building blocks of an emergent system. The diagram exudes simplicity, yet beneath its clean exterior lies the potential for unexpected and welcome developments. Picture a few nodes breaking away from the predetermined path, symbolizing the cool surprises that can arise when allowing for unanticipated outcomes.


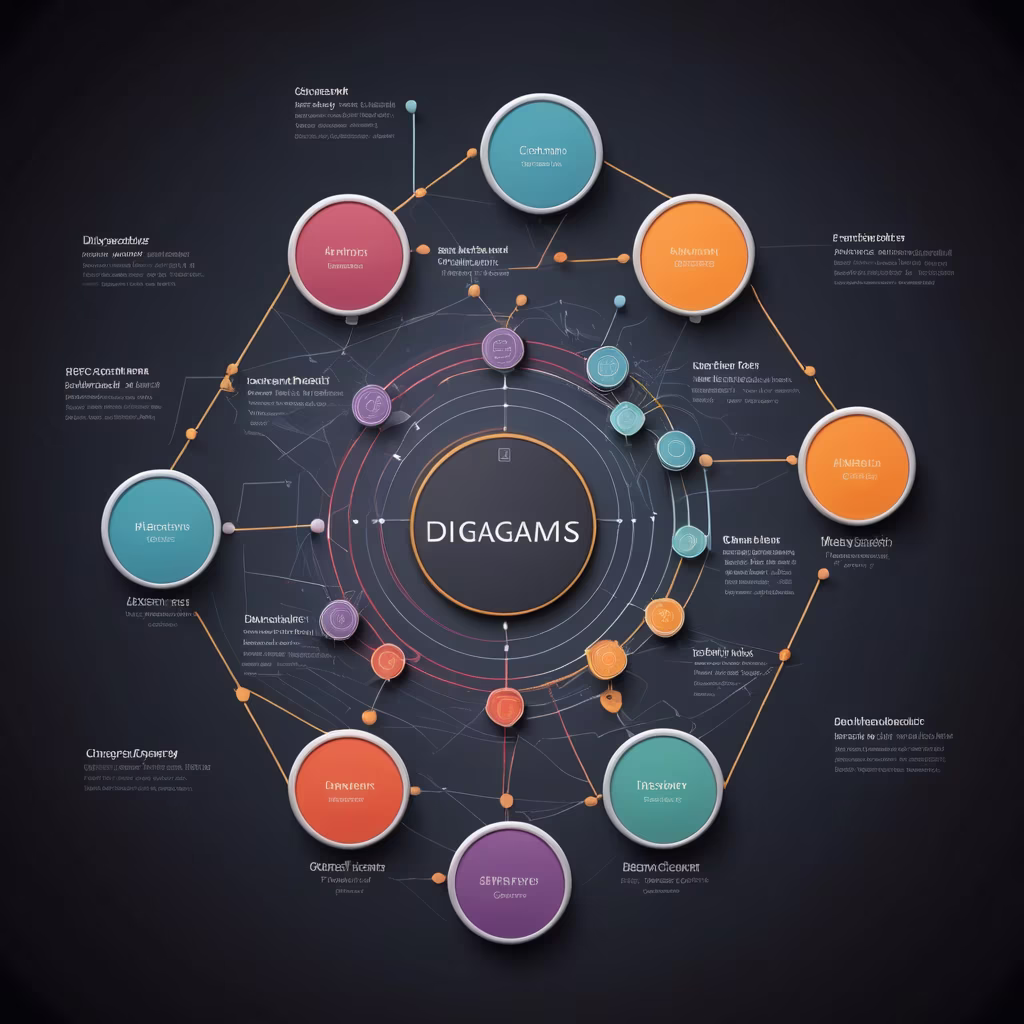
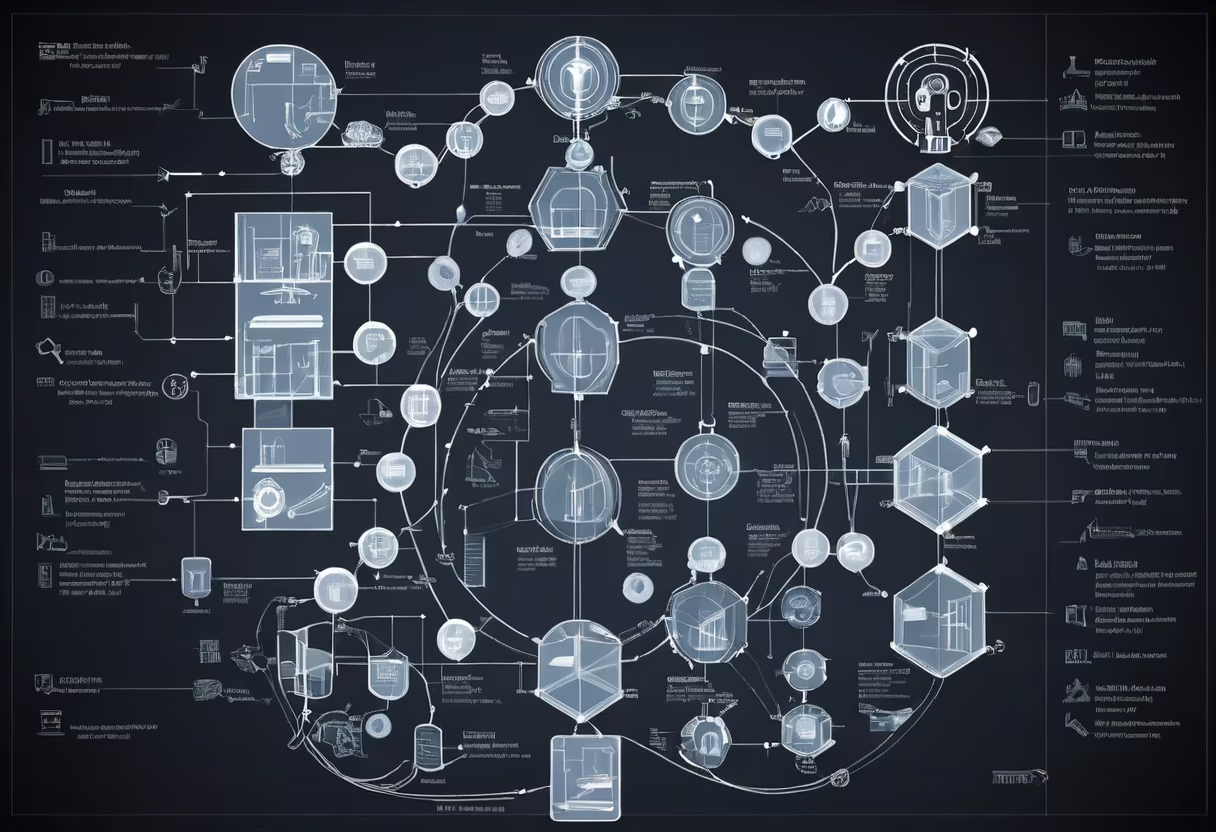
Prompt: Data repositories, knowledge graph, semantic indexing, blue data visualization, information architecture, comprehensive datasets, deep learning analytics, cognitive computing, domain-specific insights, ontology mapping, structured knowledge, interconnected data nodes, blue-themed data mining, in-depth data curation, contextual data representation, graph-based knowledge storage, comprehensive data catalog, blue spectrum information retrieval, robust data ecosystem, knowledge enrichment.


Prompt: Data repositories, knowledge graph, semantic indexing, blue data visualization, information architecture, comprehensive datasets, deep learning analytics, cognitive computing, domain-specific insights, ontology mapping, structured knowledge, interconnected data nodes, blue-themed data mining, in-depth data curation, contextual data representation, graph-based knowledge storage, comprehensive data catalog, blue spectrum information retrieval, robust data ecosystem, knowledge enrichment.


Prompt: Data repositories, knowledge graph, semantic indexing, blue data visualization, information architecture, comprehensive datasets, deep learning analytics, cognitive computing, domain-specific insights, ontology mapping, structured knowledge, interconnected data nodes, blue-themed data mining, in-depth data curation, contextual data representation, graph-based knowledge storage, comprehensive data catalog, blue spectrum information retrieval, robust data ecosystem, knowledge enrichment.


Prompt: solo, (squirrel tail:1.3), 1 squirrel girl, jeadite eyes, squirrel ears, medium hair, (smile:1.1), (open mouth:0.8), small face, medium breasts, sleeveless, frills waitress, miniskirt, sweets, standing, (in cafeteria:1.1), chair, table, (forest:0.5), (dappled sunlight:1.1), sharp focus, looking at viewer, cowboy shot, (intricate:1.1), (light green theme:1.2), (light green tone:1.2), (gold tone:0.5), illustration, \u003clora:more_details:0.5\u003e,
Negative: blush, worst quality, large head, low quality, extra digits, bad eye, EasyNegativeV2, ng_deepnegative_v1_75t, text, jpeg artifacts, signature, watermark, username, artist name, trademark, title, light, window, lamp,
Style: Analog Film


Prompt: golden casino slot machine, jackpot win, front angle, rendered in CGI, rendered in 3DSMAX, r, rendered in cinema4d, rendered in keyshot, rendered in povray, high quality 3d render, black background, 8k resolution


Prompt: Generate an image showcasing different types of memory modules, including DDR3, DDR4, and DDR5, with labels highlighting their key features.


Prompt: Picture a fluid mosaic of interconnected pathways and bridges, representing the streamlined systems. The mechanics are symbolized by a series of interconnected, smooth-flowing channels, highlighting the seamless flow of operations. User-friendly controls are illustrated through intuitive touchpoints, emphasizing the ease of navigation. Best practices in interface design manifest as clear signposts and markers along the pathways, guiding users with simplicity. Important information is displayed prominently, akin to well-lit landmarks in the visual landscape.
Style: Comic Book


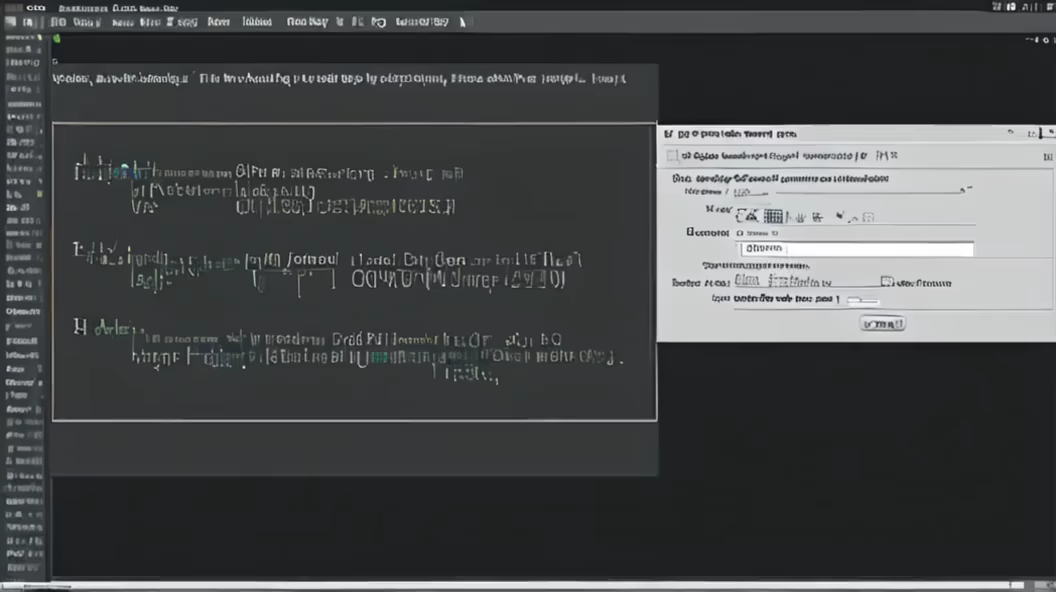
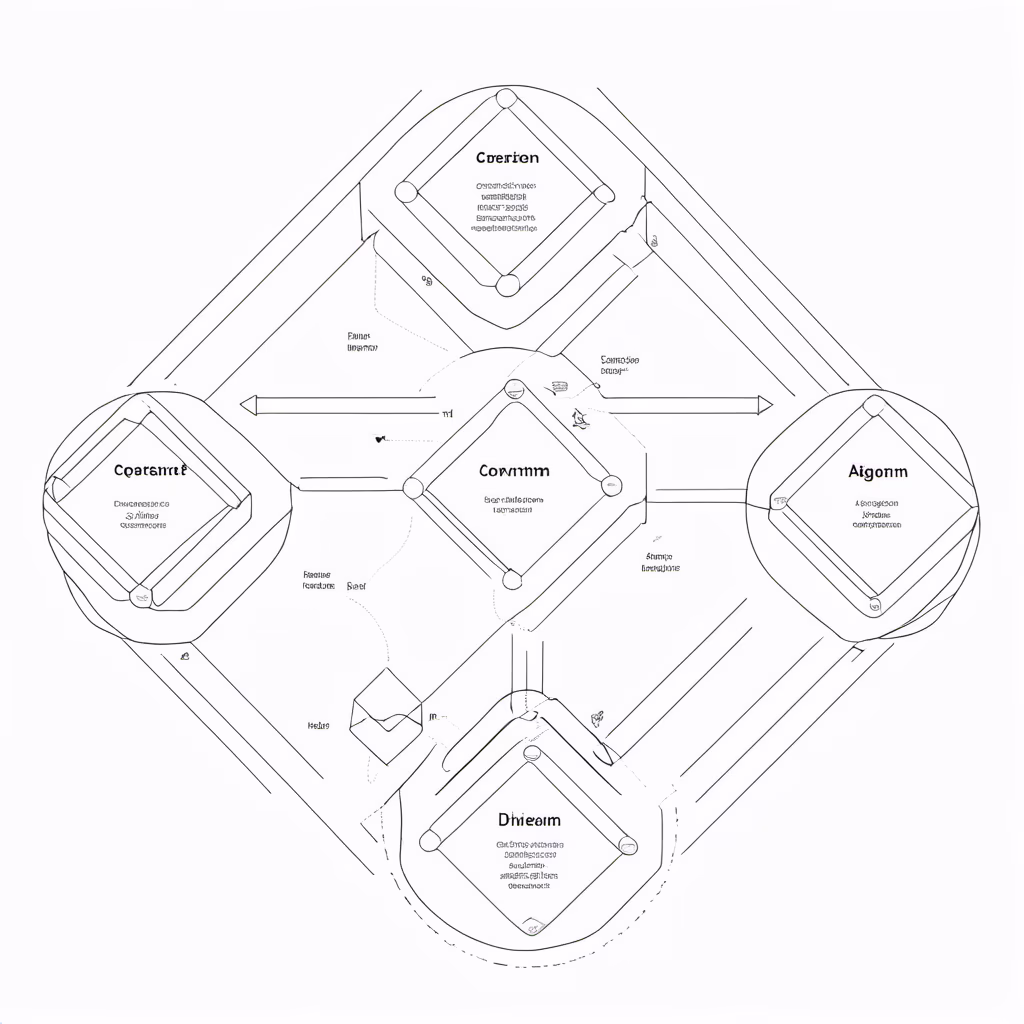
Prompt: Initial Node Extraction: Use GPT-4 with one-shot prompting to extract nodes from user scenarios. Iterative Refinement: Collaboratively refine nodes through user feedback, ensuring alignment with the specific scenario. Node Categorization: Employ GPT-4's advanced NLP to classify nodes into categories like Event, Opportunity, Trigger, etc., for structured network topology.

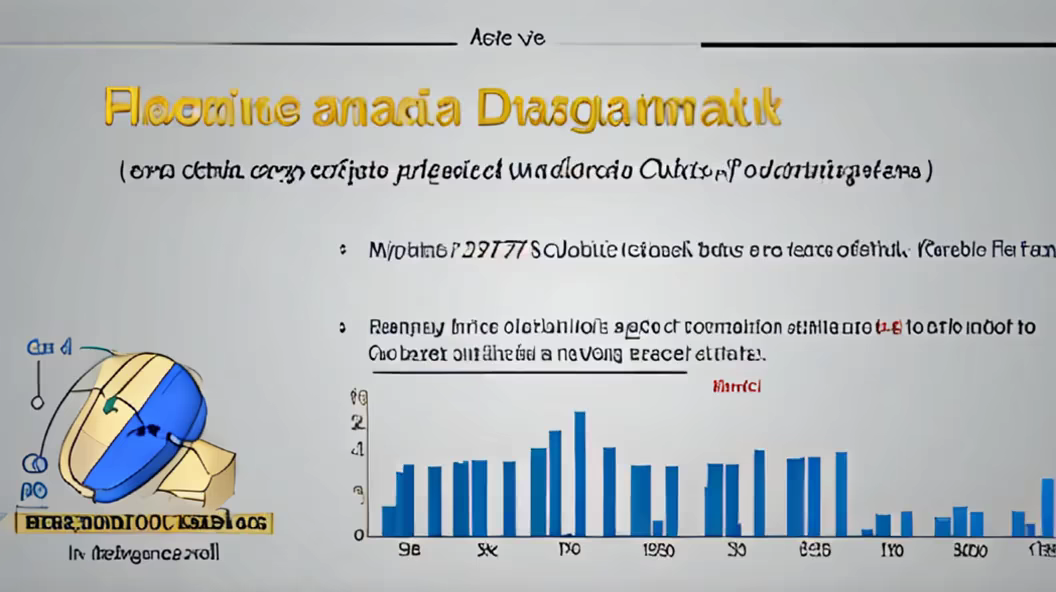
Prompt: \"Please help me create a framework diagram according to the following requirements.\"Create a machine learning model that can predict the average price of a house based on its features. The specific steps are as follows:Reading data in Python Defining problem statement Identifying target variable Checking the distribution of the target variable Basic Data Exploration Rejecting unnecessary columns Exploratory Data Analysis for data distribution (Histograms and Bar plots) Feature selection based on data distribution Outlier handling Missing value treatment Visual correlation analysis Statistical correlation analysis (Feature Selection) Converting data to numerical for ML Sampling and K-fold Cross Validation Trying multiple regression algorithms Choosing the best model Deploying the best model in production environment
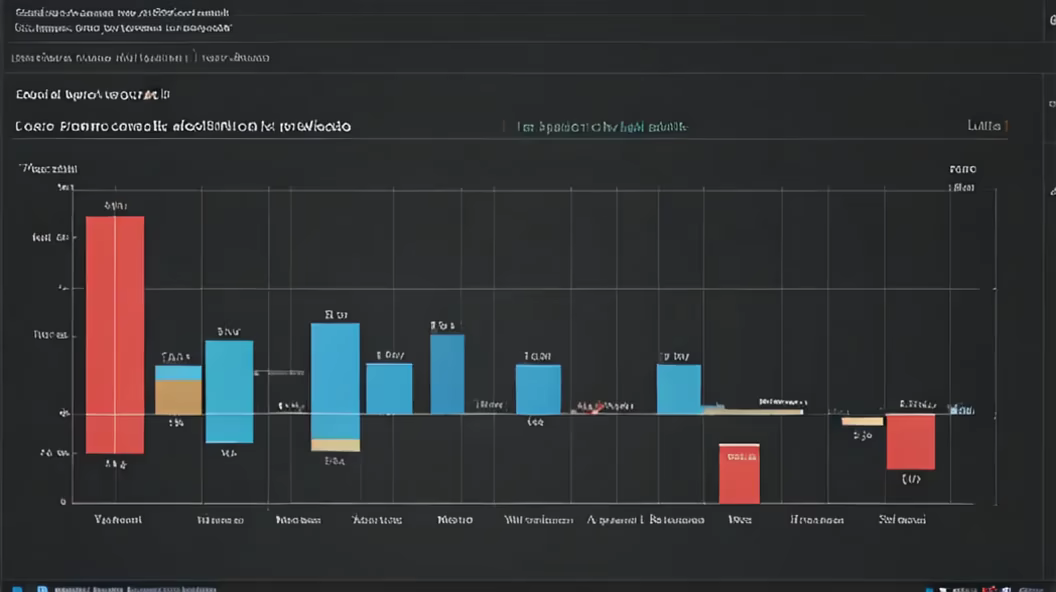
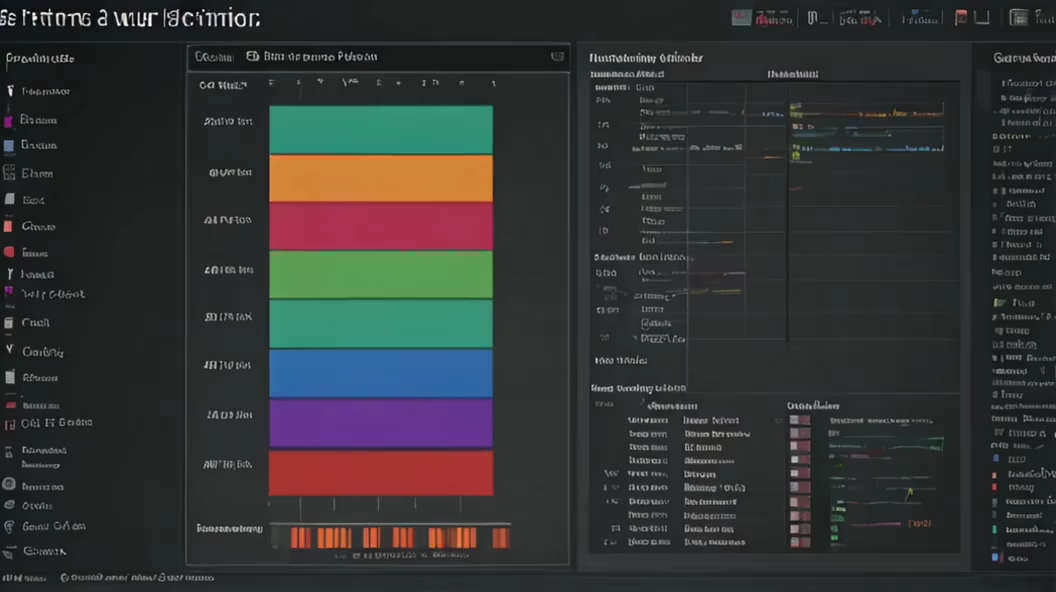


Prompt: Generate a dashboard for Microsoft, highlighting revenue from different business segments and cloud services usage.\"


Prompt: Imagine an image featuring a sleek, interconnected network of gears symbolizing streamlined systems, with each gear representing a crucial component. The mechanics are depicted as smoothly interlocking, emphasizing efficiency. The controls are portrayed as intuitive interfaces, where a user effortlessly navigates through well-designed elements. Best practices in user interface design are illustrated through clear, concise icons and labels. Important information is highlighted with vibrant indicators, ensuring visibility.


Prompt: Creating an AI collage to visually represent the capabilities of artificial intelligence throughout its journey involves the fusion of diverse elements. Begin by incorporating images of neural networks and interconnected nodes, symbolizing the complex web of algorithms that underpin AI processes. Integrate depictions of data streams and patterns, illustrating AI's ability to analyze vast datasets. Include visuals of diverse technologies like robotic arms, smart devices, and machine learning symbols to represent the wide range of applications AI engages with. Consider incorporating futuristic imagery and subtle nods to precisionist art, reflecting the progressive and evolving nature of AI. Infuse the collage with a palette of digital blues and whites, evoking a sense of technology and innovation. Ensure a dynamic composition that captures the essence of AI's transformative journey, from its theoretical foundations to its real-world applications.