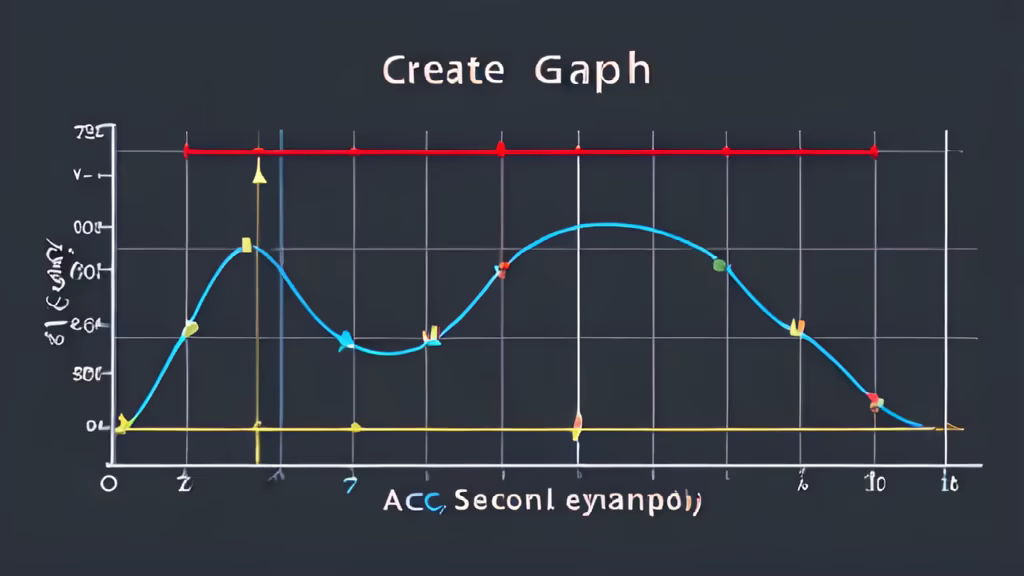
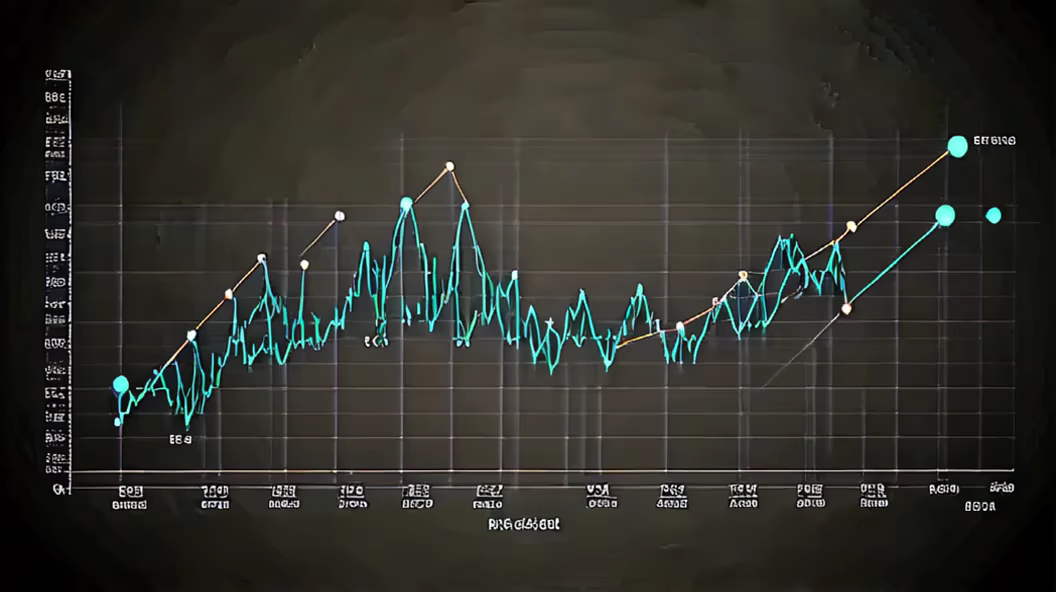
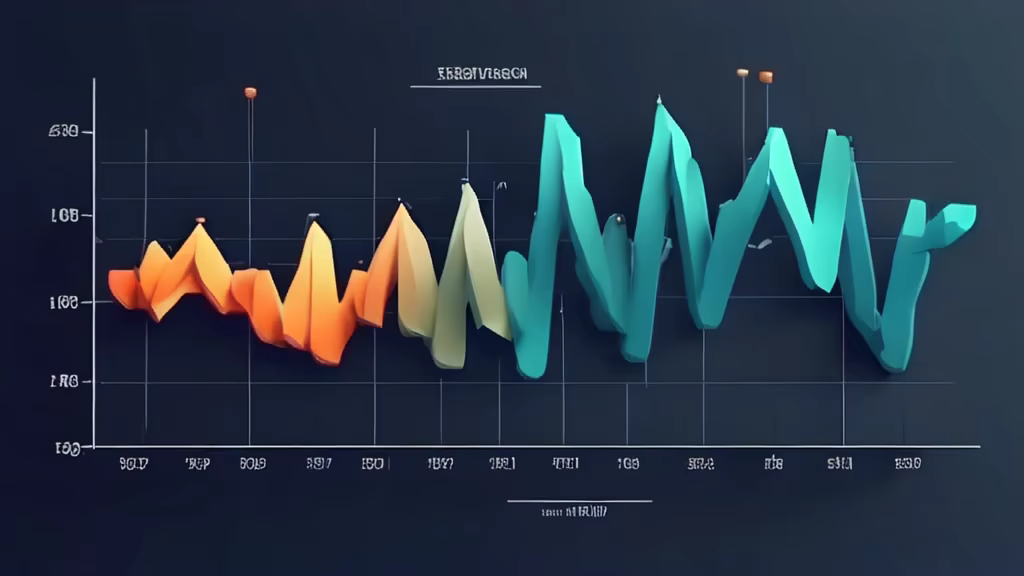
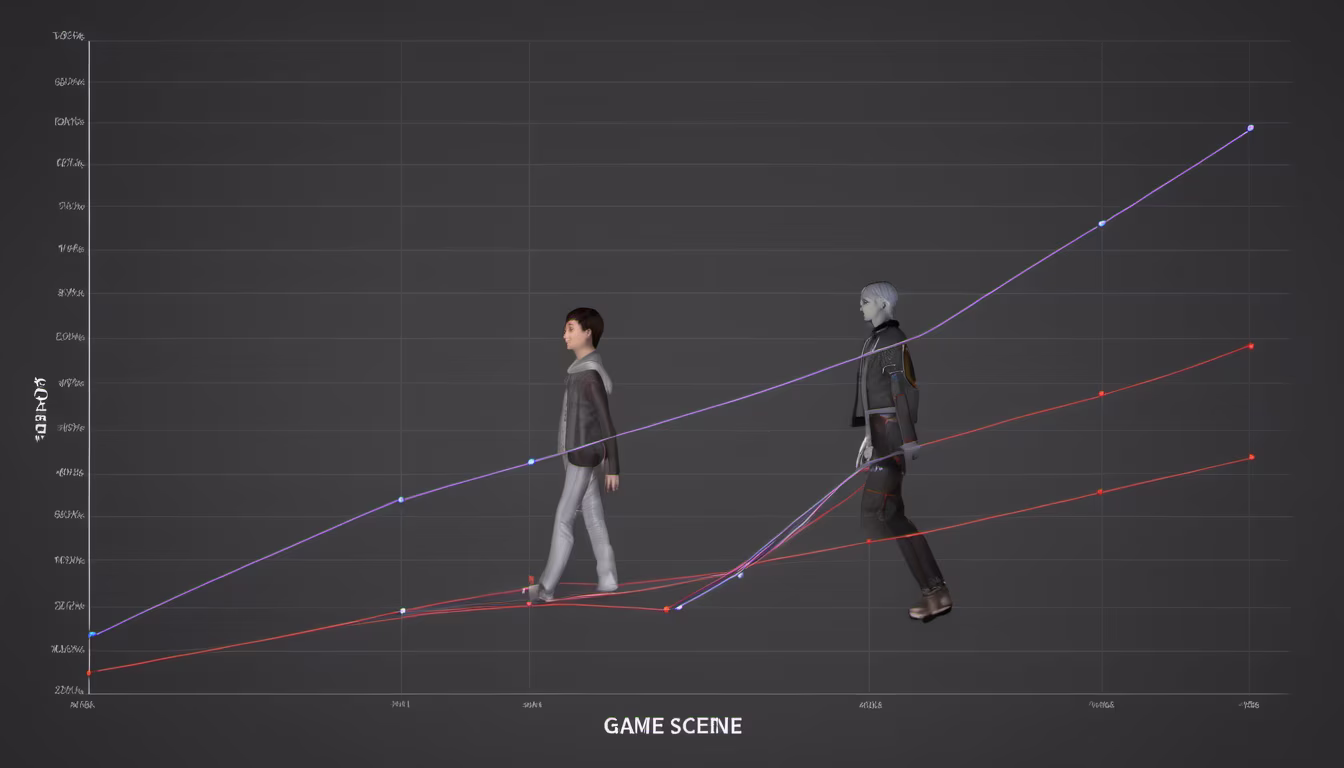
Prompt: create a 2 line graphs in a single chart where the first graph is slightly above the seccond graph and the randomly add some flat lines the graph should also look like matplotlib was used and the title is \"acc vs v-acc\" x_labels = [0, 20, 40, 60, 80, 100, 120, 140] y_labels = [0, 0.65, 0.70, 0.75, 0.80, 0.85, 0.90]


Prompt: 2d cartoon characters, caricatured form, full body head and legs, superhero Black Vulcan (Harvey Birdman), brutal, shining, flashes, splashes, lightning, halo, glow, light rays, against the background of a detailed complex evil dark wonderland, rage, anger, aggression, ready to take on any opponent with his strength and supernatural abilities, strength, power, cartoon scenes, sci-fi, fantasy, action pose, dnd character, DC Comics style, 70s TV series, dark light, vibrant color, high detailed background, high detail, best quality, cartoon, by Jack Kirby, Alex Ross, Giger, Frank Mille, Boris Vallejo
Negative: low quality, low-grade, twins, duplicate, fused finger, missing arm, missing leg, extra finger, poorly drawn hand, poorly drawn face, deformed, bad proportion, cloned face, disfigured, extra limb, bad anatomy, gross proportion, malformed limb,extra legs, extra arms, identical positions, duplicates, repeats, ultra realistic, no expression, blurry, 3d, ugly face, low detail, empty background, out of crop, minimalistic, badly drawn, superman, batman, ironman,
Style: Comic Book


Prompt: It was a sunny day. A tall white young man in a bright jersey sat resting on the floor of a basketball court with a basketball in his arms. He smiled and looked at his cell phone on the floor in front of him


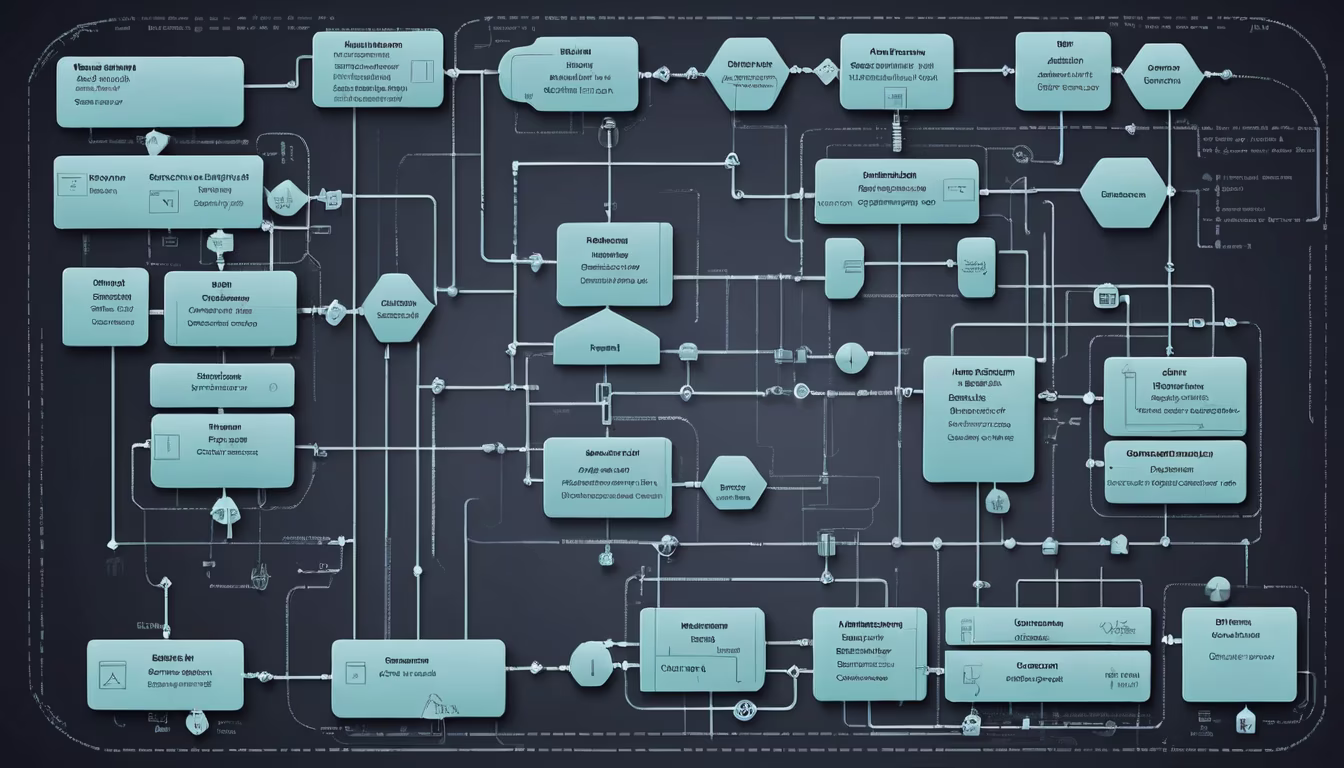
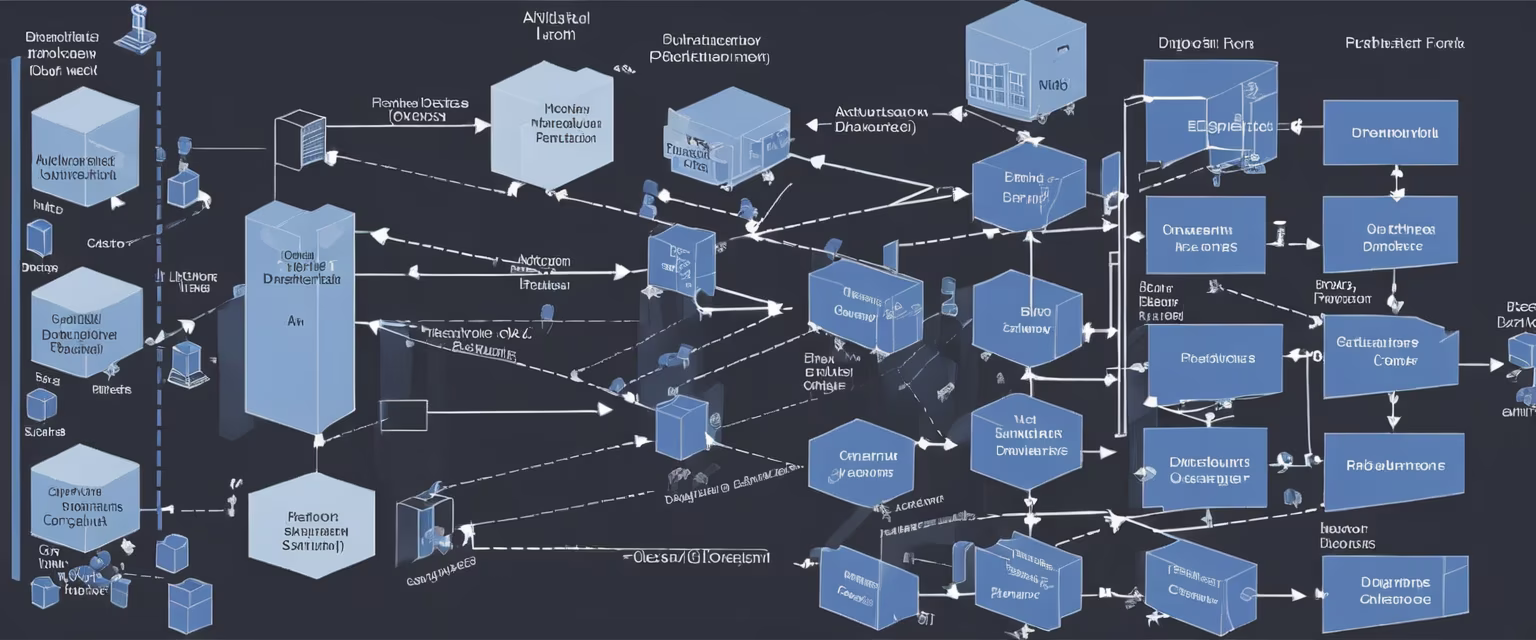
Prompt: \"Please help me create a framework diagram according to the following requirements.\"Create a machine learning model that can predict the average price of a house based on its features. The specific steps are as follows:Reading data in Python Defining problem statement Identifying target variable Checking the distribution of the target variable Basic Data Exploration Rejecting unnecessary columns Exploratory Data Analysis for data distribution (Histograms and Bar plots) Feature selection based on data distribution Outlier handling Missing value treatment Visual correlation analysis Statistical correlation analysis (Feature Selection) Converting data to numerical for ML Sampling and K-fold Cross Validation Trying multiple regression algorithms Choosing the best model Deploying the best model in production environment


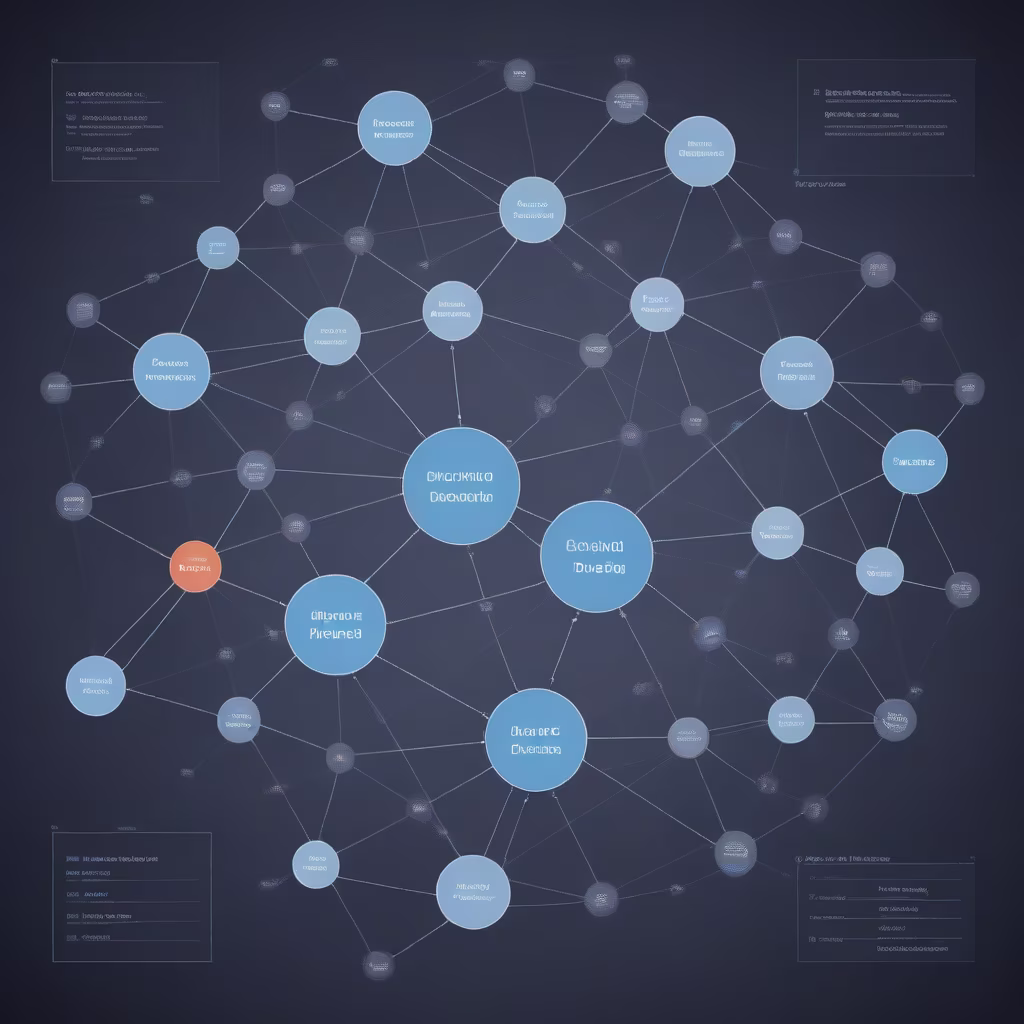
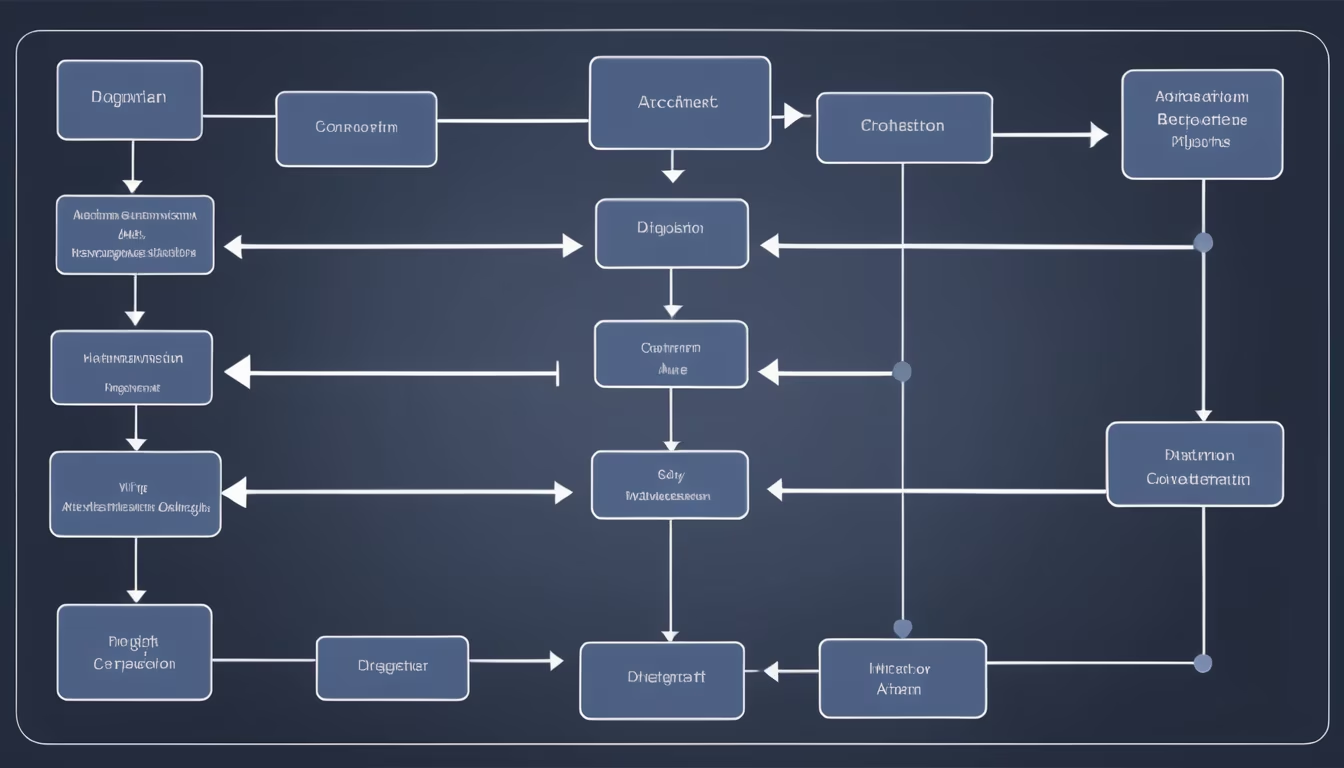
Prompt: a graph that connects dream reports through text similarity, nlp, compsci, tree data structure


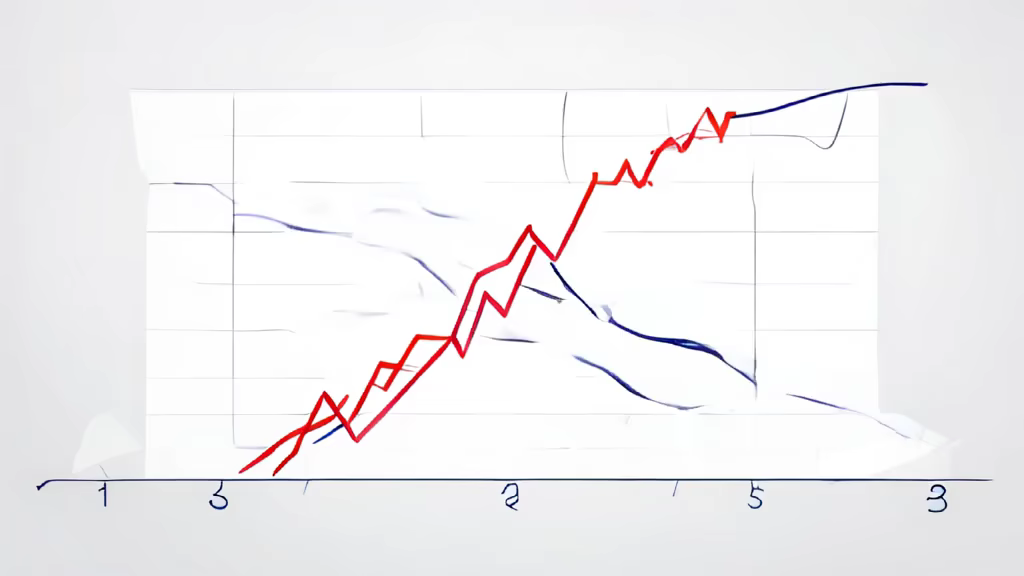
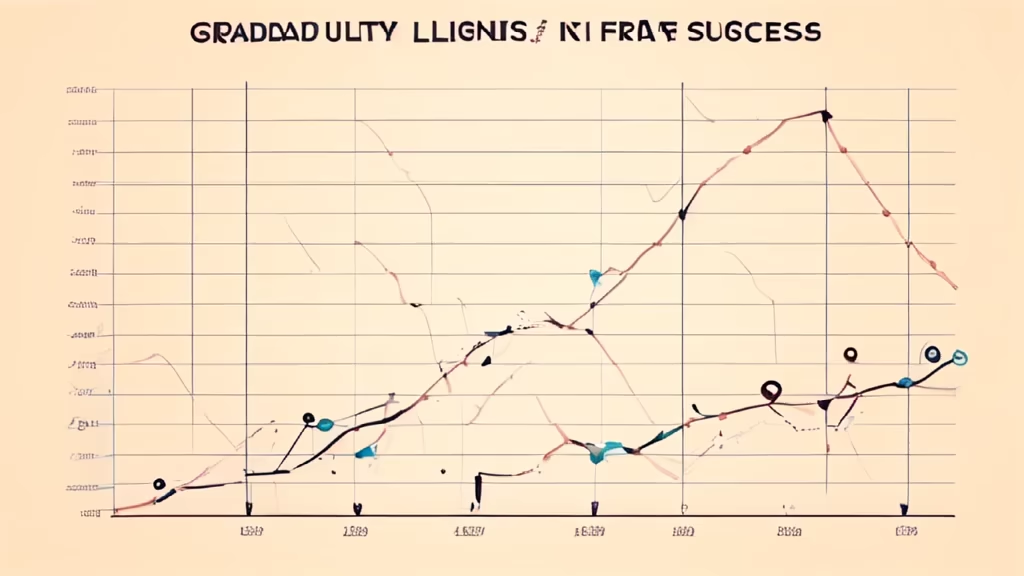
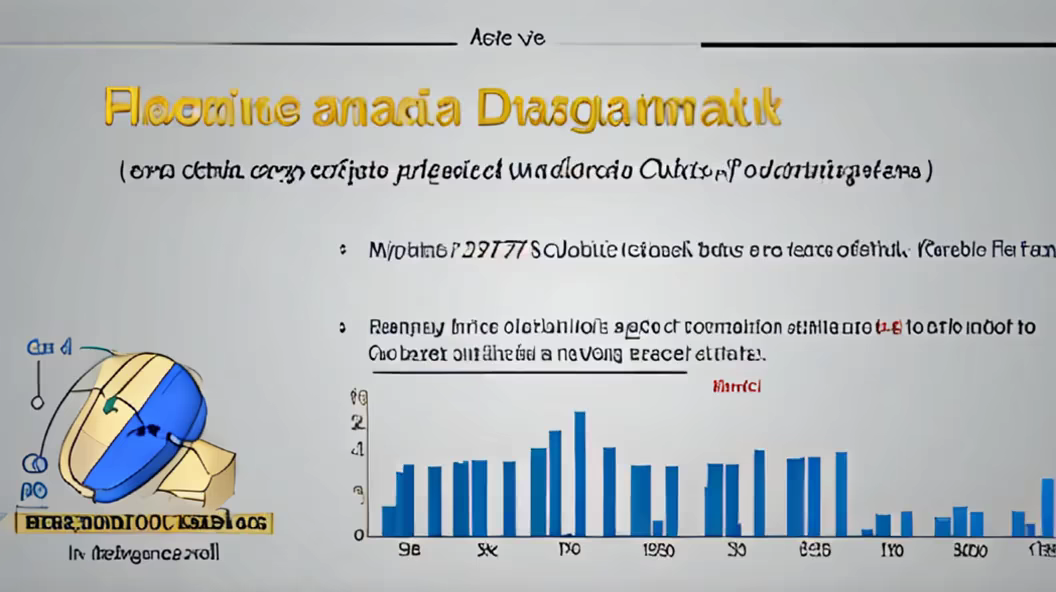
Prompt: Show me a sample chart that measures the total wealth of adults in the U.S. relative to age.


Prompt: https://cdn.discordapp.com/attachments/1151338762987646986/1191887291472429086/IMG_5417.png?ex=65a7128a\u0026is=65949d8a\u0026hm=5014a3df068bf846924c431cbf4c8996d275ebfb2e90913ee35e2ca554c00ebd\u0026 anime girl torn apart by industrial machinery in the Gary Works steel complex in Gary, Indiana
Style: Comic Book


Prompt: Draw a DNA spiral vine, scientific English style inside profile diagram, in the form of a picture, only one way spiral vine profile diagram


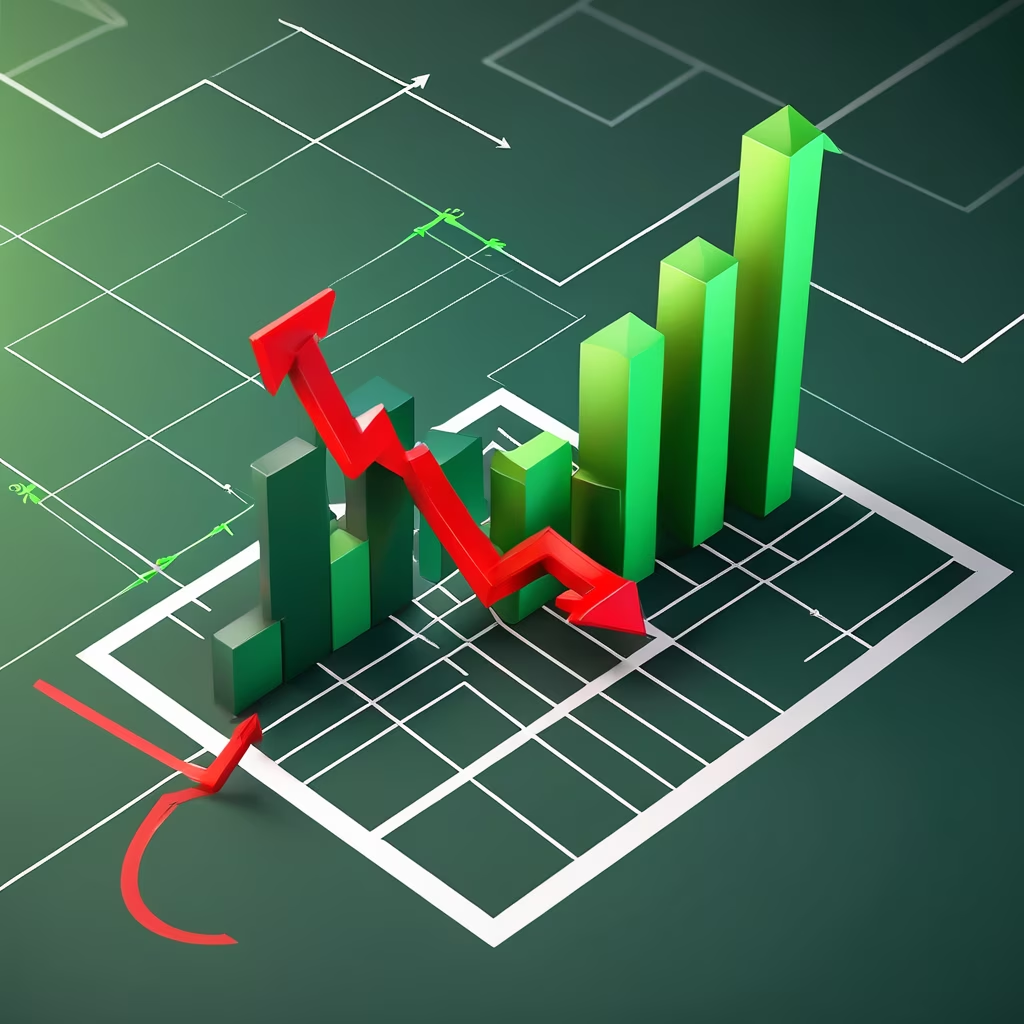
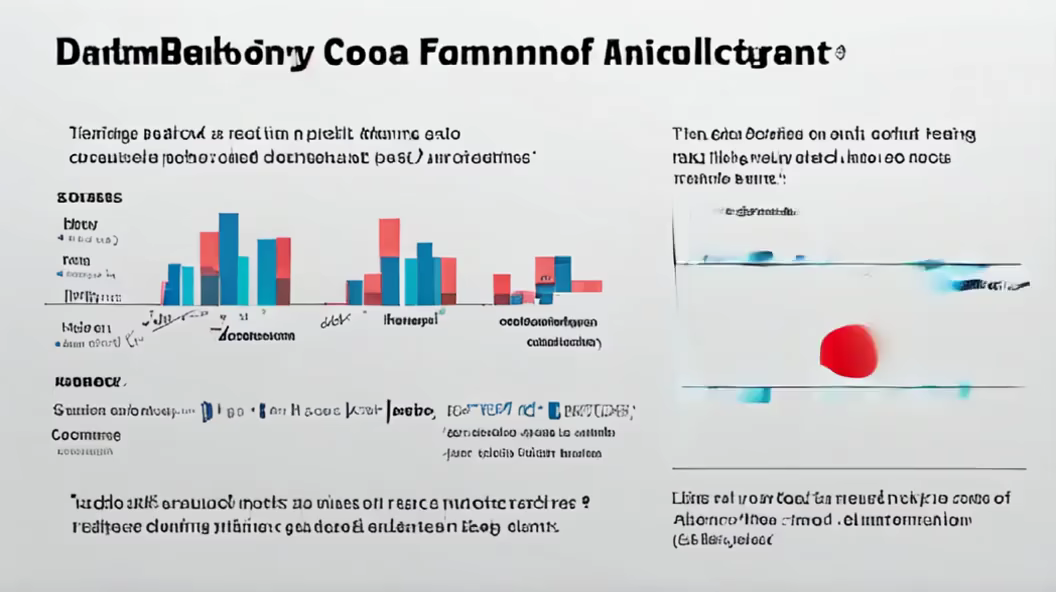
Prompt: dream prompt:create a visualization infographic to show opportunities and challenges of a low-carbon economy, data visualization, charts, graphs, modern design


Prompt: Generate an image of a computer screen displaying a graph of mysterious signals, hinting at potential extraterrestrial communication.


Prompt: Python, based on the data provided by the text, sequentially calls the interface and records the feedback data in a CSV file