Prompt: Year:1952. Formal portrait. High detail, Canon EOS DSLR photograph. UHD, 8K resolution, sharp focus, full color, intimate, intricately detailed and extreme close up facial portrait of a fashionable age 29 wife in 1952, showcasing her generously and profusely highlighted, very short, curly blonde hair. She coyly smirks at the camera. Her very thick, richly textured hair fills the viewing screen and is delicately styled in a short, sleek, compact, tight, very curly bouffant. She has subtle, elegant makeup. Solid, light colored background. Accurate 1952 styling.
Negative: (earrings: 1.6) outdoors, outdoor setting, loose tendrils of hair, jewelry, hair beyond camera view, cropped hair, tiara, orange colors, black and white image, nudity, NSFW,
Style: Photographic


Prompt: It was a sunny day. A tall white young man in a bright jersey sat resting on the floor of a basketball court with a basketball in his arms. He smiled and looked at his cell phone on the floor in front of him


Prompt: Scenes from a movie, Ace of a young Sandra Bullock strange woman in bed feeling very pleased, luxury, smilling but crying, but hurting, she is in ecstasy, long curly golden hair, hot body, muscle, chubby, smiling, asleep on a pullout couch, wearing night suit, sleeping, in a dingy living room, white top, sun light, unsettling vibes, cinematic, HD, real person, taken with a 50mm prime lens at f/ 2. 8 --ar 2:1


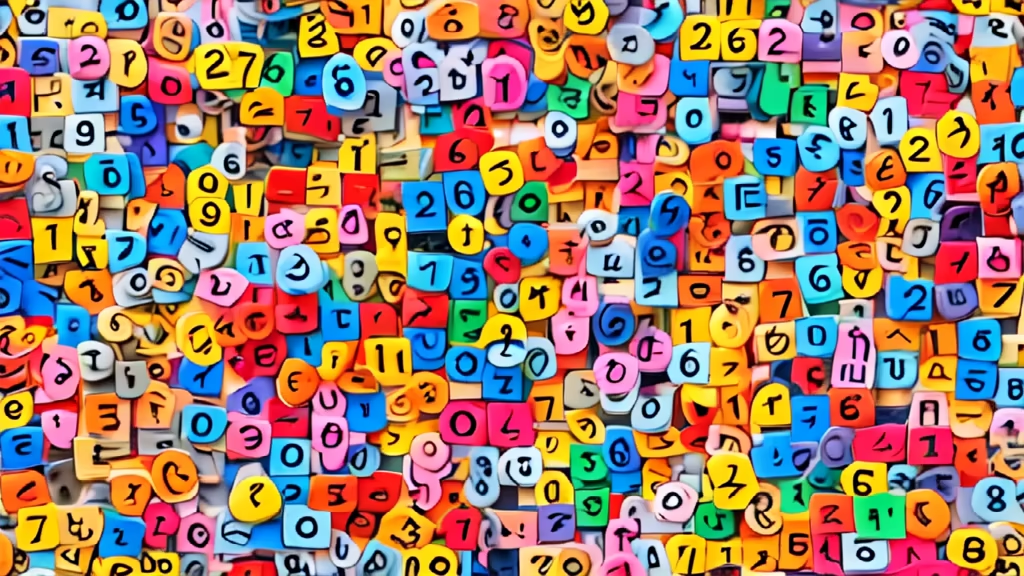
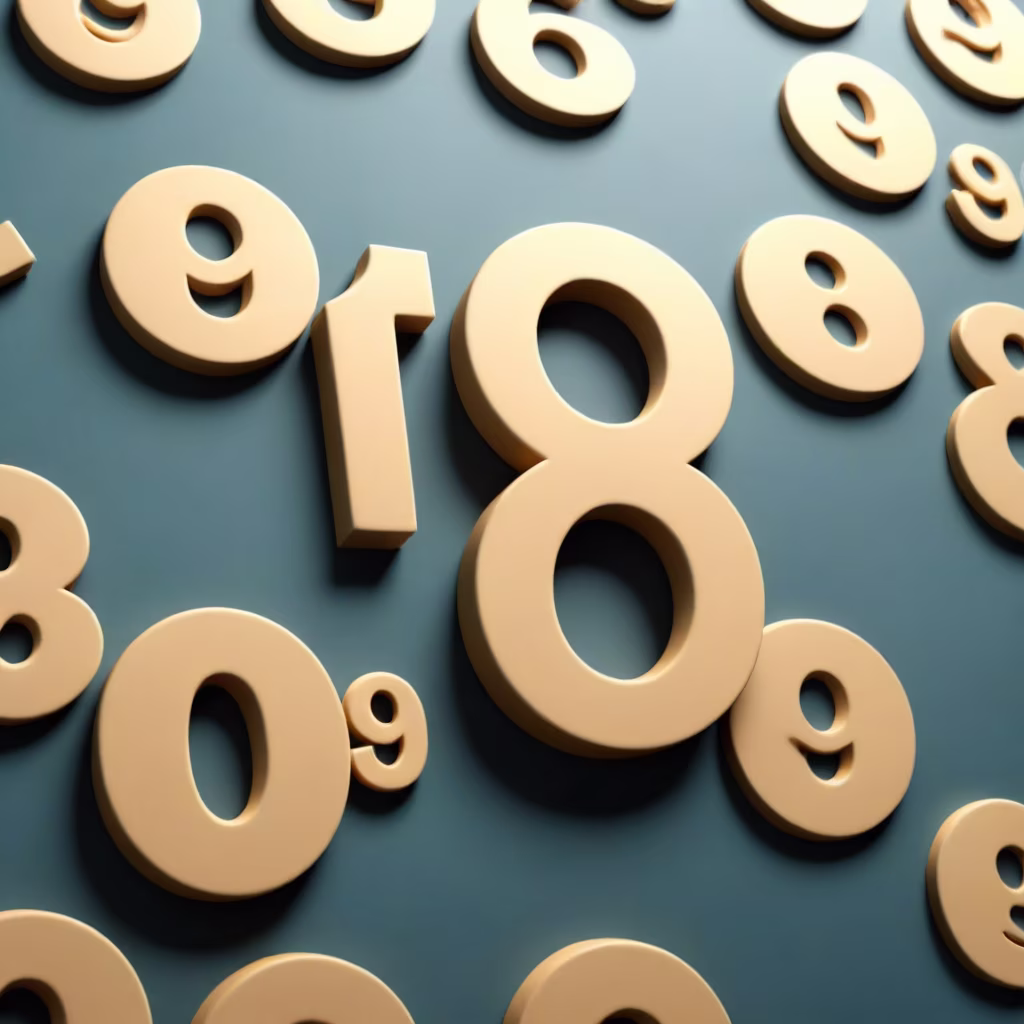
Prompt: faith in numbers, numerology, numbers numbers are everywhere, faith in numbers as in God, the god of numbers, there are many numbers flying everywhere, numbers are glowing


Prompt: a person sitting on a chair in a studio setup, plain background with currency counting machine, with stacks of money filled around him, realistic image, hd resolution, fun context, exaggerated, ai generated, simple lighting,


Prompt: I have no idea what kind of query to generate, so come up with a query yourself and what to generate too


Prompt: create a 2 line graphs in a single chart where the first graph is slightly above the seccond graph and the randomly add some flat lines the graph should also look like matplotlib was used and the title is \"acc vs v-acc\" x_labels = [0, 20, 40, 60, 80, 100, 120, 140] y_labels = [0, 0.65, 0.70, 0.75, 0.80, 0.85, 0.90]