Prompt: create a visualization infographic to show opportunities and challenges of a low-carbon economy, data visualization, charts, graphs,pastel colors, blue and green, light background


Prompt: create a visualization infographic to show opportunities and challenges of a low-carbon economy, data visualization, charts, graphs,pastel colors,high contrast, blue and green, light background


Prompt: create a visualization infographic to show opportunities and challenges of a low-carbon economy, data visualization, charts, graphs, high contrast, blue and green, light background

Prompt: dream prompt:create a visualization infographic to show opportunities and challenges of a low-carbon economy, data visualization, charts, graphs,pastel colors, blue and green, light background


Prompt: create a visualization infographic to show opportunities and challenges of a low-carbon economy, data visualization, charts, graphs, high contrast, blue and green, white background


Prompt: create a visualization infographic to show opportunities and challenges of a low-carbon economy, data visualization, charts, graphs, icons,pastel colors,modern design


Prompt: dream prompt:create a visualization infographic to show opportunities and challenges of a low-carbon economy, data visualization, charts, graphs, icons,pastel colors,modern design

Prompt: dream prompt:create a visualization infographic to show opportunities and challenges of a low-carbon economy, data visualization, charts, graphs,pastel colors,modern design


Prompt: create a visualization infographic to show opportunities and challenges of a low-carbon economy, data visualization, charts, graphs, high contrast, light background


Prompt: dream prompt:create a visualization infographic to show opportunities and challenges of a low-carbon economy, data visualization, charts, graphs,pastel colors, high contrast
Prompt: dream prompt:create a visualization infographic to show opportunities and challenges of a low-carbon economy, data visualization, charts, graphs,pastel colors, blue and green, light background
Style: 3D Model


Prompt: create a visualization infographic to show opportunities and challenges of a low-carbon economy, charts, graphs, icons, modern design


Prompt: dream prompt:create a visualization infographic to show opportunities and challenges of a low-carbon economy, data visualization, charts, graphs, modern design


Prompt: create a visualization infographic to show opportunities and challenges of a low-carbon economy, charts, graphs, icons, modern design, pastel colors
Style: Digital Art


Prompt: illustration, globalization impact, global,city, light blue,green and yellow,globalization,Carbon neutrality, carbon peak, zero carbon emissions,energy conservation and emission reduction


Prompt: An information graphic showing the opportunities and challenges of transitioning to a low-carbon economy. The graphic should: Have a clear title that says \"Opportunities and Challenges of the Low-Carbon Economy\" Divide the graphic into two sections - one highlighting opportunities in green, the other challenges in blue List 4-6 key opportunities such as growth of renewable energy industries, energy efficiency savings, new green jobs, etc. List 4-6 key challenges such as transition costs for high-carbon industries, developing low-carbon technologies, shifting energy infrastructure, changing consumer behavior, etc. Represent data points like projected renewable energy growth and greenhouse gas emission reductions using charts like bar graphs Connect opportunities and challenges with arrows or lines to show their relationships Use a simple, clean design with good typography, spacing and organization to make the information easy to understand Be high quality and high resolution, suitable for print or online publication The goal is to communicate in a visual, graphic-led format the business case for transitioning to clean energy and emissions reductions by outlining both the upside potential and downside risks in a balanced, coherent way.


Prompt: Academic poster,globalization impact, global,city, light blue, light green and light yellow,globalization,Carbon neutrality, carbon peak, zero carbon emissions,energy conservation and emission reduction


Prompt: An information graphic showing the opportunities and challenges of transitioning to a low-carbon economy. The graphic should have a clear title that says \"Opportunities and Challenges of the Low-Carbon Economy\" Divide the graphic into two sections - one highlighting opportunities in green, the other challenges in blue List 4-6 key opportunities such as growth of renewable energy industries, energy efficiency savings, new green jobs, etc. List 4-6 key challenges such as transition costs for high-carbon industries, developing low-carbon technologies, shifting energy infrastructure, changing consumer behavior, etc. Represent data points like projected renewable energy growth and greenhouse gas emission reductions using charts like bar graphs Connect opportunities and challenges with arrows or lines to show their relationships Use a simple, clean design with good typography, spacing and organization to make the information easy to understand Be high quality and high resolution, suitable for print or online publication


Prompt: background image for mobile app, green eco theme, place for 3 pie charts, pastel colours, aspect:9:16
Prompt: background image for mobile app, green eco theme, place for 3 pie charts, pastel colours, aspect:9:16


Prompt: Data Visualization, Clean Background, Blue, Single Subject, 3D Model, Minimalist Design, Clarity, Graphical Representation, Visual Data, Information Display, Modern Aesthetics, Simplicity, Elegant Design, Technological Sophistication, Depth Perception, Dynamic Visuals, Vivid Colors, Spatial Arrangement, Digital Transformation, Futuristic Elements


Prompt: Carbon neutrality, carbon peak, zero carbon emissions,illustration, globalization impact, Macao,city, light blue,green and yellow
Prompt: Flowchart, with various icons, 3D, flowing lines between various icons, UI design, green tone, various data BI analysis, digital twin


Prompt: A complex visual page has a lot of chart data that can be extracted in the background,Transportation industryBlue toneSense of science and technology


Prompt: background image for mobile app dashboard showing temperature and voltage and ambient temperature, green eco theme, car theme, pastel colours


Prompt: background image for mobile app dashboard showing temperature and voltage and ambient temperature, green eco theme, car theme, pastel colours


Prompt: Simple lines like electrical circuits on a clean white background. Shades of blue and green add a technological edge, while images of resistors and molecules add a scientific touch to the design. Light highlights add movement


Prompt: background image for mobile app dashboard showing temperature and voltage and ambient temperature, green eco theme, car theme, pastel colours, weight: 1800, height: 3200


Prompt: Generate an image with a blue background featuring a background illustration of a 30% transparent digital analytics chart. The image should convey a sense of technology, be concise and clear, and should not include any human figures

Prompt: Generate a promotional poster image, with blue as the main color, and some illusory backgrounds with a modern and technological feel. The transparency is below 30%, flattened, highlighting the theme of data intelligence, without small icon elements, and introducing digital technological elements. , emphasizing the theme of digital ecology, not having concrete physical icons, 8k high definition.


Prompt: Generate a promotional poster image, with blue as the main color, and some illusory backgrounds with a modern and technological feel. The transparency is below 30%, flattened, highlighting the theme of data intelligence, without small icon elements, and introducing digital technological elements. , emphasizing the theme of digital ecology, not having concrete physical icons, 8k high definition.


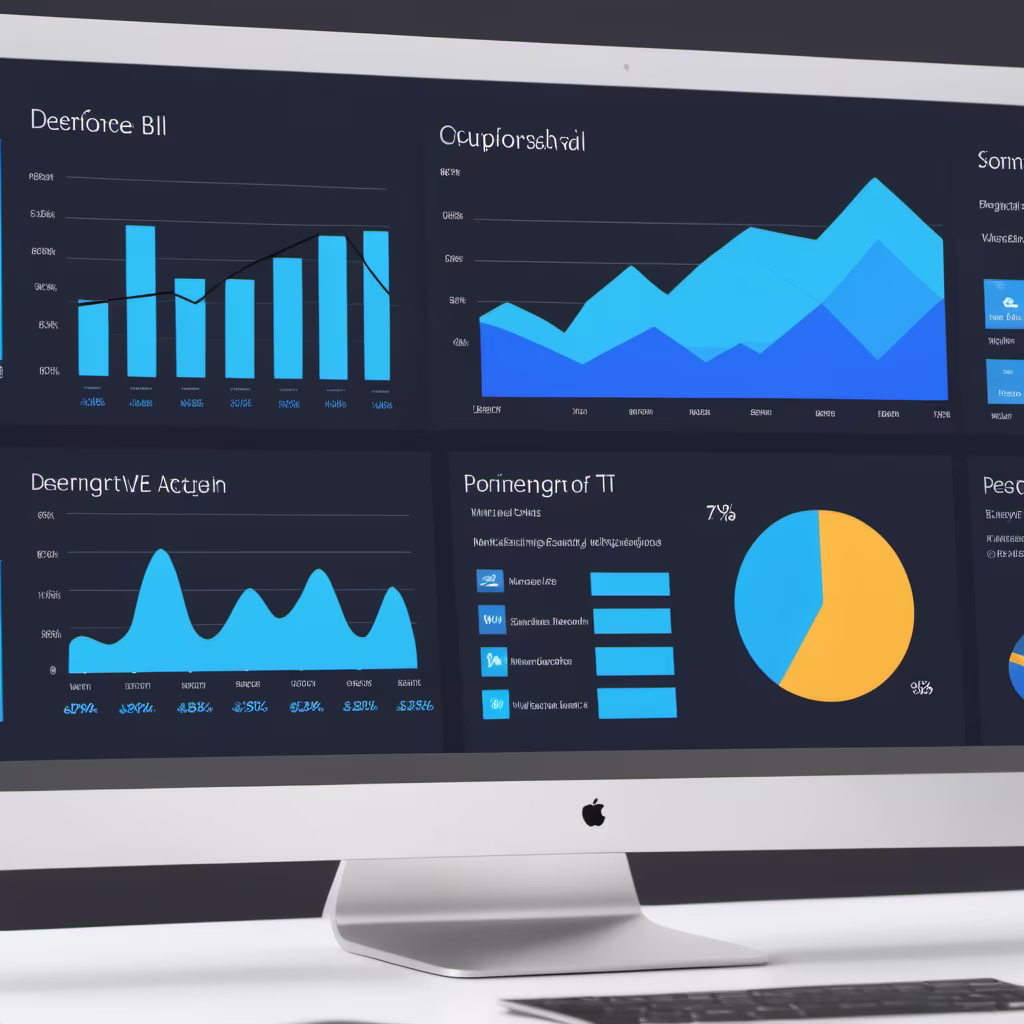
Prompt: Create a blue image featuring an icon for digital analysis and a bar chart. The image should be simple and clear, suitable as an illustration for a PowerPoint presentation


Prompt: `8-bit Pixel art, large pixels gorgeous blonde woman dancing with 2 daughters, bright lime green clothing, super low res,`Style: `Pixel Art`


Prompt: Generate a promotional poster image, with blue as the main color, and some illusory backgrounds with a modern and technological feel. The transparency is below 30%, highlighting the theme of data intelligence, without small icon elements, introducing digital technology elements, and emphasizing numbers. For an ecological theme, don’t have concrete icons, 8k high definition.


Prompt: Generate a promotional poster image, with blue as the main color, and some illusory backgrounds with a modern and technological feel. The transparency is below 30%, highlighting the theme of data intelligence, without small icon elements, introducing digital technology elements, and emphasizing numbers. For an ecological theme, don’t have concrete icons, 8k high definition.


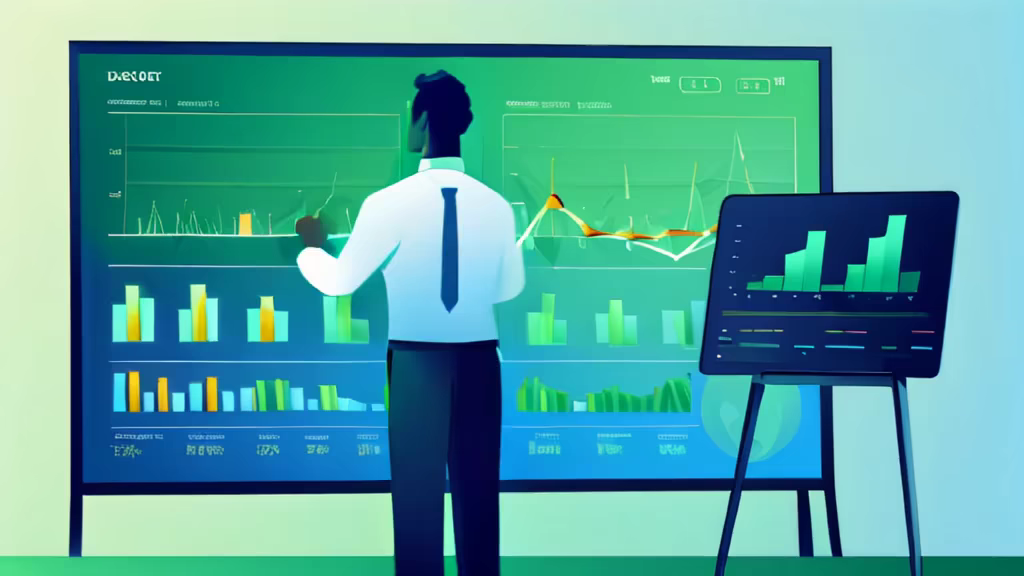
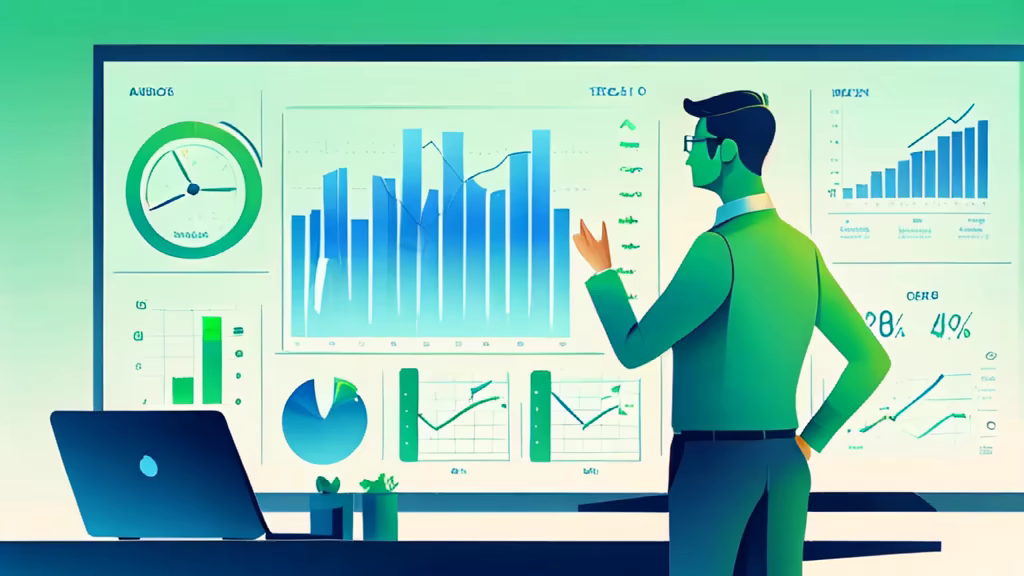
Prompt: Flat illustration of a office worker standing in front of a dashboard with chart, green and blue, gradient
Prompt: Flowchart with various icons, 3D, flowing lines between various icons, UI design, green tone,


Prompt: realistic and ultra-clear, it is 1955, a gang of rockers with two girls are on a street next to a Chevrolet, they are wearing leather clothes and toupees, the girls are wearing red plaid skirts and shirts


Prompt: flat illustration, a office worker standing in front of a dashboard with charts, blue and cyan, gradient, simple and clean, minimalist,


Prompt: PPT Background, Background on Smart Healthcare, Light Green Background, Color is very light and sophisticated, with medical and computer elements, not exceeding two colors.


Prompt: blue background has two swirled shapes, There is no content in the upper half, in the style of internet academia, high horizon lines, chemical reactions, ps1 graphics, vibrant worlds, translucent water, Central curved three-dimensional arc, curve shapes, blue-green


