Prompt: dream prompt:create a visualization infographic to show opportunities and challenges of a low-carbon economy, data visualization, charts, graphs,pastel colors,modern design


Prompt: dream prompt:create a visualization infographic to show opportunities and challenges of a low-carbon economy, data visualization, charts, graphs, icons,pastel colors,modern design

Prompt: dream prompt:create a visualization infographic to show opportunities and challenges of a low-carbon economy, data visualization, charts, graphs,pastel colors, high contrast
Prompt: dream prompt:create a visualization infographic to show opportunities and challenges of a low-carbon economy, data visualization, charts, graphs, modern design


Prompt: dream prompt:create a visualization infographic to show opportunities and challenges of a low-carbon economy, data visualization, charts, graphs,pastel colors, blue and green, light background


Prompt: create a visualization infographic to show opportunities and challenges of a low-carbon economy, data visualization, charts, graphs, icons,pastel colors,modern design


Prompt: create a visualization infographic to show opportunities and challenges of a low-carbon economy, data visualization, charts, graphs,pastel colors, blue and green, light background


Prompt: create a visualization infographic to show opportunities and challenges of a low-carbon economy, data visualization, charts, graphs,pastel colors,high contrast, blue and green, light background


Prompt: create a visualization infographic to show opportunities and challenges of a low-carbon economy, data visualization, charts, graphs, high contrast, light background


Prompt: create a visualization infographic to show opportunities and challenges of a low-carbon economy, data visualization, charts, graphs, high contrast, blue and green, light background

Prompt: create a visualization infographic to show opportunities and challenges of a low-carbon economy, data visualization, charts, graphs, high contrast, blue and green, white background


Prompt: create a visualization infographic to show opportunities and challenges of a low-carbon economy, charts, graphs, icons, modern design, pastel colors
Style: Digital Art


Prompt: create a visualization infographic to show opportunities and challenges of a low-carbon economy, charts, graphs, icons, modern design


Prompt: dream prompt:create a visualization infographic to show opportunities and challenges of a low-carbon economy, data visualization, charts, graphs,pastel colors, blue and green, light background
Style: 3D Model


Prompt: `8-bit Pixel art, large pixels gorgeous blonde woman dancing with 2 daughters, bright lime green clothing, super low res,`Style: `Pixel Art`


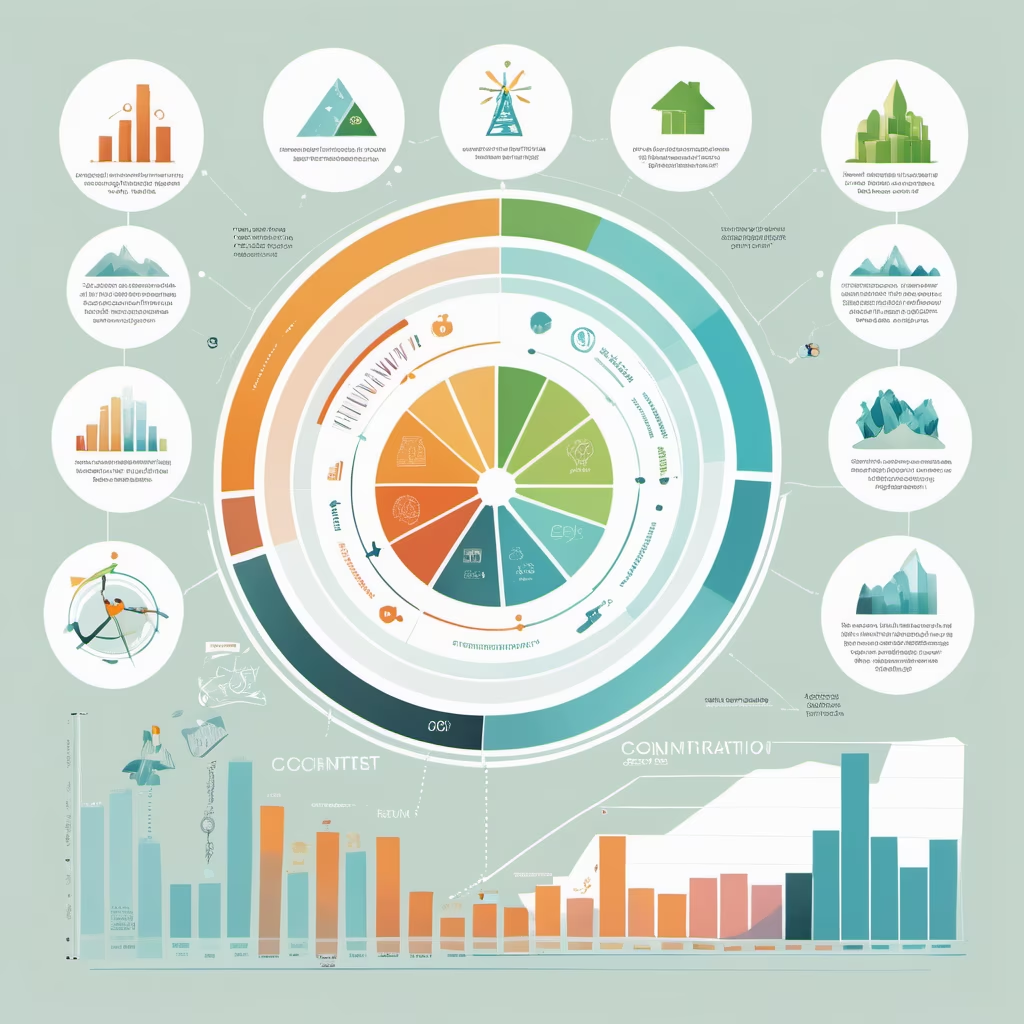
Prompt: An information graphic showing the opportunities and challenges of transitioning to a low-carbon economy. The graphic should: Have a clear title that says \"Opportunities and Challenges of the Low-Carbon Economy\" Divide the graphic into two sections - one highlighting opportunities in green, the other challenges in blue List 4-6 key opportunities such as growth of renewable energy industries, energy efficiency savings, new green jobs, etc. List 4-6 key challenges such as transition costs for high-carbon industries, developing low-carbon technologies, shifting energy infrastructure, changing consumer behavior, etc. Represent data points like projected renewable energy growth and greenhouse gas emission reductions using charts like bar graphs Connect opportunities and challenges with arrows or lines to show their relationships Use a simple, clean design with good typography, spacing and organization to make the information easy to understand Be high quality and high resolution, suitable for print or online publication The goal is to communicate in a visual, graphic-led format the business case for transitioning to clean energy and emissions reductions by outlining both the upside potential and downside risks in a balanced, coherent way.

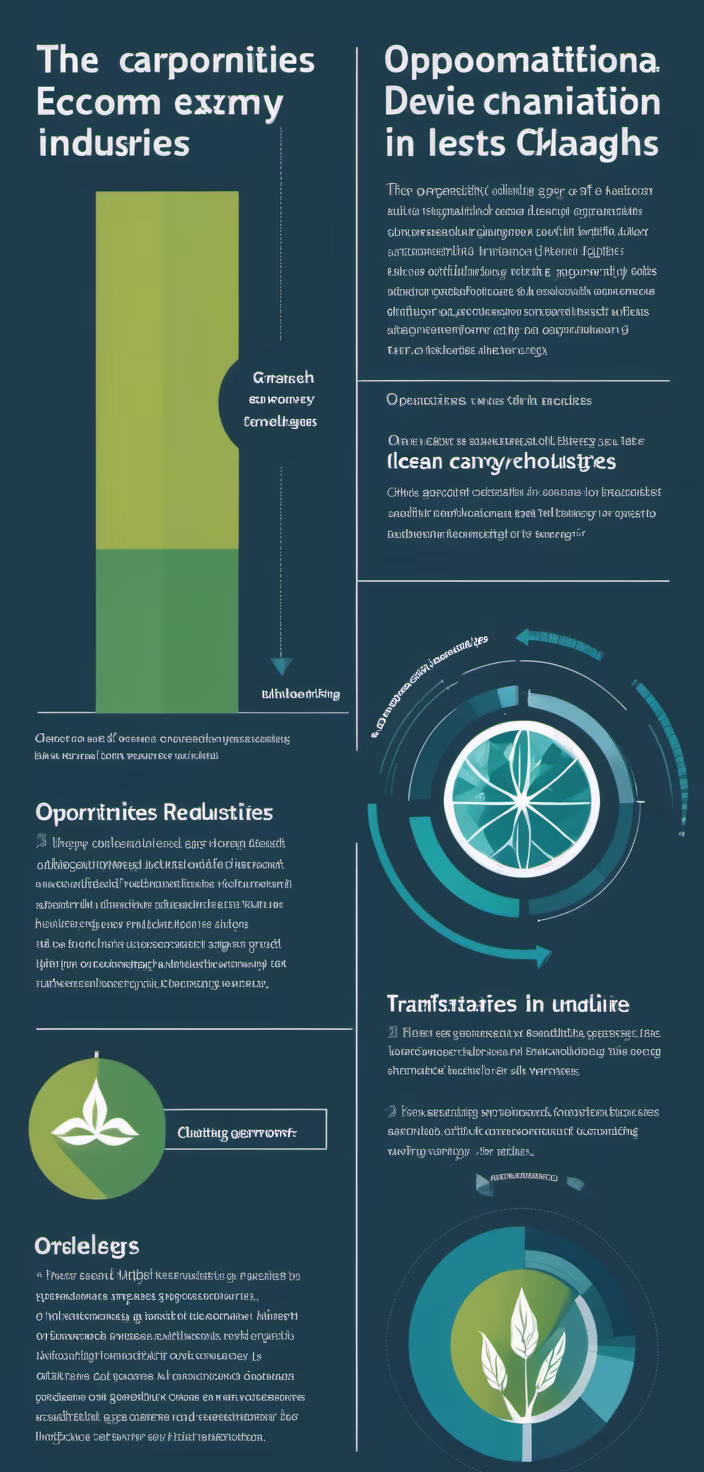


Prompt: An information graphic showing the opportunities and challenges of transitioning to a low-carbon economy. The graphic should have a clear title that says \"Opportunities and Challenges of the Low-Carbon Economy\" Divide the graphic into two sections - one highlighting opportunities in green, the other challenges in blue List 4-6 key opportunities such as growth of renewable energy industries, energy efficiency savings, new green jobs, etc. List 4-6 key challenges such as transition costs for high-carbon industries, developing low-carbon technologies, shifting energy infrastructure, changing consumer behavior, etc. Represent data points like projected renewable energy growth and greenhouse gas emission reductions using charts like bar graphs Connect opportunities and challenges with arrows or lines to show their relationships Use a simple, clean design with good typography, spacing and organization to make the information easy to understand Be high quality and high resolution, suitable for print or online publication


Prompt: create a simple, colorful data visualization graphic to visualize two data points: (1) 100+ building facilities (2) 10 million+ sq ft of building space.


Prompt: an air filter app interface for a different functions and buttons on it UI/UX, figma, adobe, minimalist with logo and charts, functionality, stylist, performance chart, circles, without words


Prompt: background image for mobile app dashboard showing temperature and voltage and ambient temperature, green eco theme, car theme, pastel colours


Prompt: background image for mobile app dashboard showing temperature and voltage and ambient temperature, green eco theme, car theme, pastel colours


Prompt: Academic poster,globalization impact, global,city, light blue, light green and light yellow,globalization,Carbon neutrality, carbon peak, zero carbon emissions,energy conservation and emission reduction


Prompt: background image for mobile app, green eco theme, place for 3 pie charts, pastel colours, aspect:9:16
Prompt: background image for mobile app, green eco theme, place for 3 pie charts, pastel colours, aspect:9:16


Prompt: an air filter app mobile interface for a different functions and buttons on it UI/UX, minimalist with logo and charts, functionality, stylist


Prompt: /imagine prompt: In a flat design style, envision a Chinese university student moving through a bar graph, each section representing a distinct stage of their life. The graph is depicted with clean lines and simple shapes, emphasizing a minimalist and modern aesthetic. Illuminate the journey with subtle and stylized lighting, creating a sense of clarity and focus as the student builds dreams for the future. The scene conveys a commitment to guiding and supporting young scholars (\"芊芊学子\"). Communicate that 2023 is a checkpoint, not the final destination. Express gratitude to the mentors (\"护书人\") since 1949, with visual elements portraying their enduring influence on the student's journey. As the university student advances, illustrate the road widening, symbolizing the increasing breadth of opportunities and knowledge. Incorporate a straightforward yet impactful visual representation of a paper airplane's flight path, outlining the trajectory of the individual's life experiences. The overall composition exudes a contemporary and streamlined feel, encapsulating the essence of a Chinese university student's progression through the years.


Prompt: background image for mobile app dashboard showing temperature and voltage and ambient temperature, green eco theme, car theme, pastel colours, weight: 1800, height: 3200


Prompt: A modern and elegant website user interface with a clean and intuitive design. The layout is user-friendly with clear navigation and concise text. The color palette is harmonious and visually appealing, using a combination of soft pastels and bold accents. The typography is well-chosen and easy to read, with a mix of serif and sans serif fonts. The images and graphics are high-quality and relevant to the content. The overall aesthetic is professional and sophisticated, conveying a sense of trust and credibility. front view


Prompt: A modern and elegant website user interface with a clean and intuitive design. The layout is user-friendly with clear navigation and concise text. The color palette is harmonious and visually appealing, using a combination of soft pastels and bold accents. The typography is well-chosen and easy to read, with a mix of serif and sans serif fonts. The images and graphics are high-quality and relevant to the content. The overall aesthetic is professional and sophisticated, conveying a sense of trust and credibility, theme for the website, such as minimalist, modern,

Prompt: \"Market Overview - Create an informative visual representation of a market overview. The image should convey key data, trends, and insights about a specific market or industry. Medium: Visual market overview representation. Style: Choose a style that communicates professionalism and data-driven insights. Resolution: High-quality to ensure clarity of data. --ar 16:9 --v 5.1 --style informative --q 2 --s 750.
Prompt: minimal, modern graphic showing potential of the universe. Use pop-art syling, clear and soft colors


Prompt: This visual tool effectively communicates the importance of understanding the source and origin of advancements, encouraging a comprehensive comprehension of the journey leading to the final technological outcome.


Prompt: Data Visualization, Clean Background, Blue, Single Subject, 3D Model, Minimalist Design, Clarity, Graphical Representation, Visual Data, Information Display, Modern Aesthetics, Simplicity, Elegant Design, Technological Sophistication, Depth Perception, Dynamic Visuals, Vivid Colors, Spatial Arrangement, Digital Transformation, Futuristic Elements


Prompt: illustration, globalization impact, global,city, light blue,green and yellow,globalization,Carbon neutrality, carbon peak, zero carbon emissions,energy conservation and emission reduction


Prompt: minimalistic modern financial dashboard focusing on data visualization set up with blue, pink and orange color combination
Style: Digital Art


Prompt: Using seed 2436714659, create a new variation of a young woman in the style of Brian Lee O'Malley's \"Scott Pilgrim\" comics mixed with Jujutsu Kaisen Manga style, adding a subtly sexy element to her appearance. She should have a vibrant ombre hairstyle with random colors, transitioning from her natural hair color, styled in a futuristic and trendy manner. Her expression and pose should convey confidence and a bit of allure, while still fitting within the youthful and energetic aesthetic of the comic series. The illustration should have bold, clean lines with a minimalistic background, emphasizing her unique hairstyle and stylish, slightly seductive demeanor.
Style: Anime


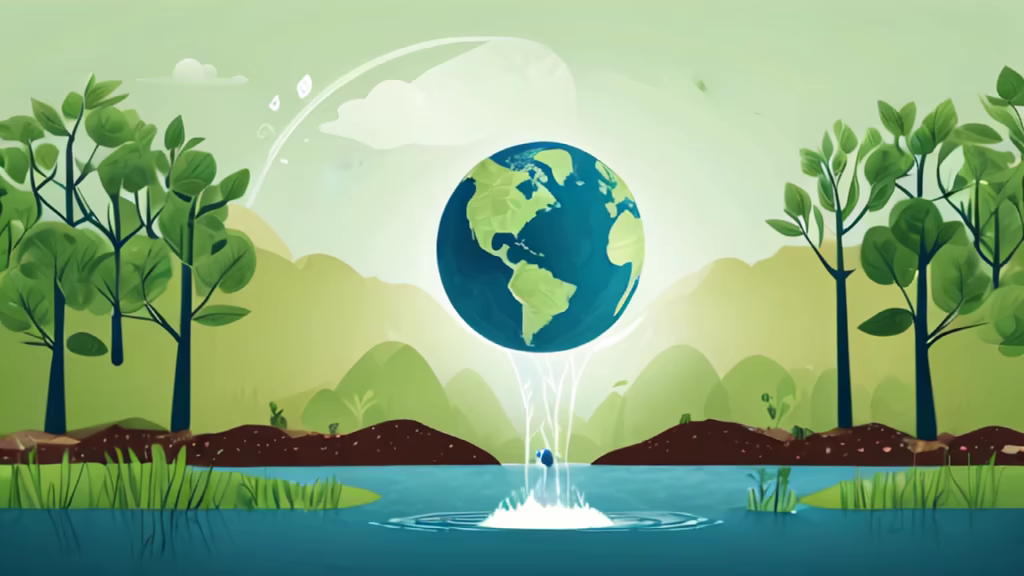
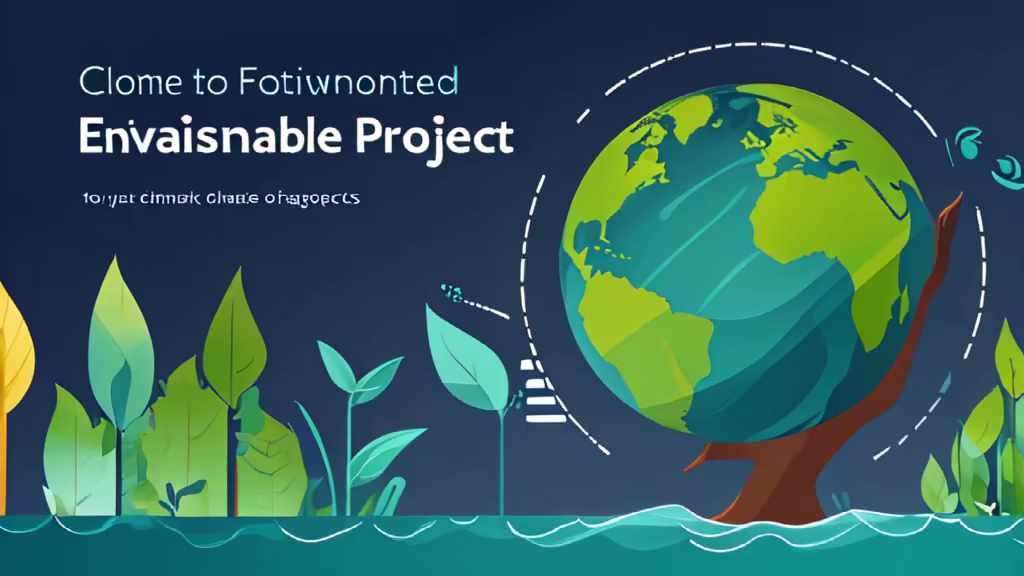
Prompt: Create a short, professional video with animated graphics illustrating the flow of funds into environmentally sustainable projects. Emphasize the global impact of climate finance and the positive changes it can bring. Use a concise and compelling voiceover to explain the importance of financial support in combating climate change.
Prompt: Create a blue image featuring an icon for digital analysis and a bar chart. The image should be simple and clear, suitable as an illustration for a PowerPoint presentation


Prompt: A complex visual page has a lot of chart data that can be extracted in the background,Transportation industryBlue toneSense of science and technology


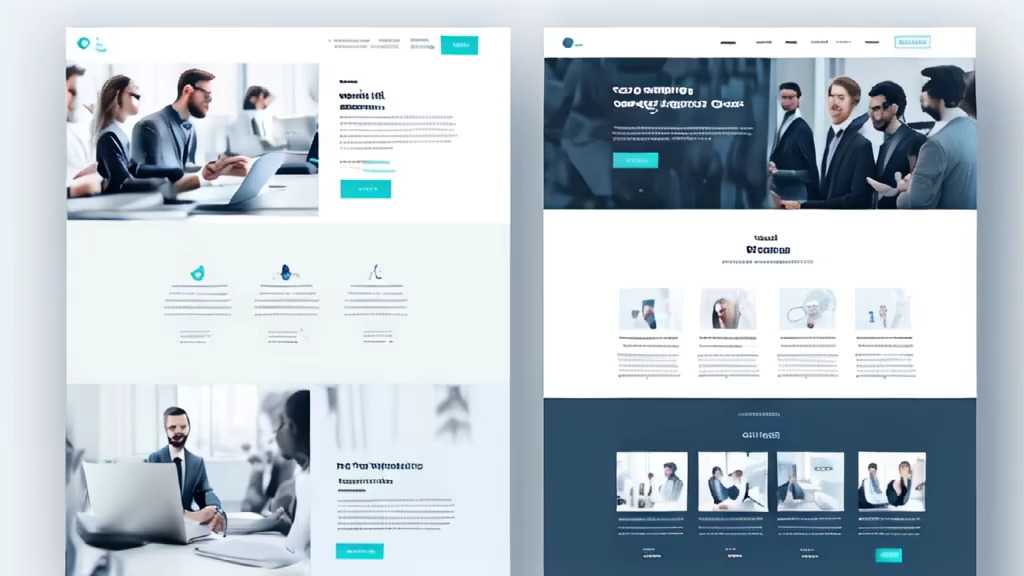
Prompt: Create a modern and clean UI design for an IT consulting website with a light color scheme. The design should include a hero section with a real photo as the background image, such as a modern office setting or a technology-related im The next section of hero section should include text that highlights the key services offered by the IT consulting firm. The text should be concise, informative, and engaging, providing visitors with a clear understanding of the firm's expertise and offerings. Use a modern and professional font that is easy to read, and ensure that the text complements the overall design aesthetic. Consider incorporating subtle animation effects to draw attention to the important information.

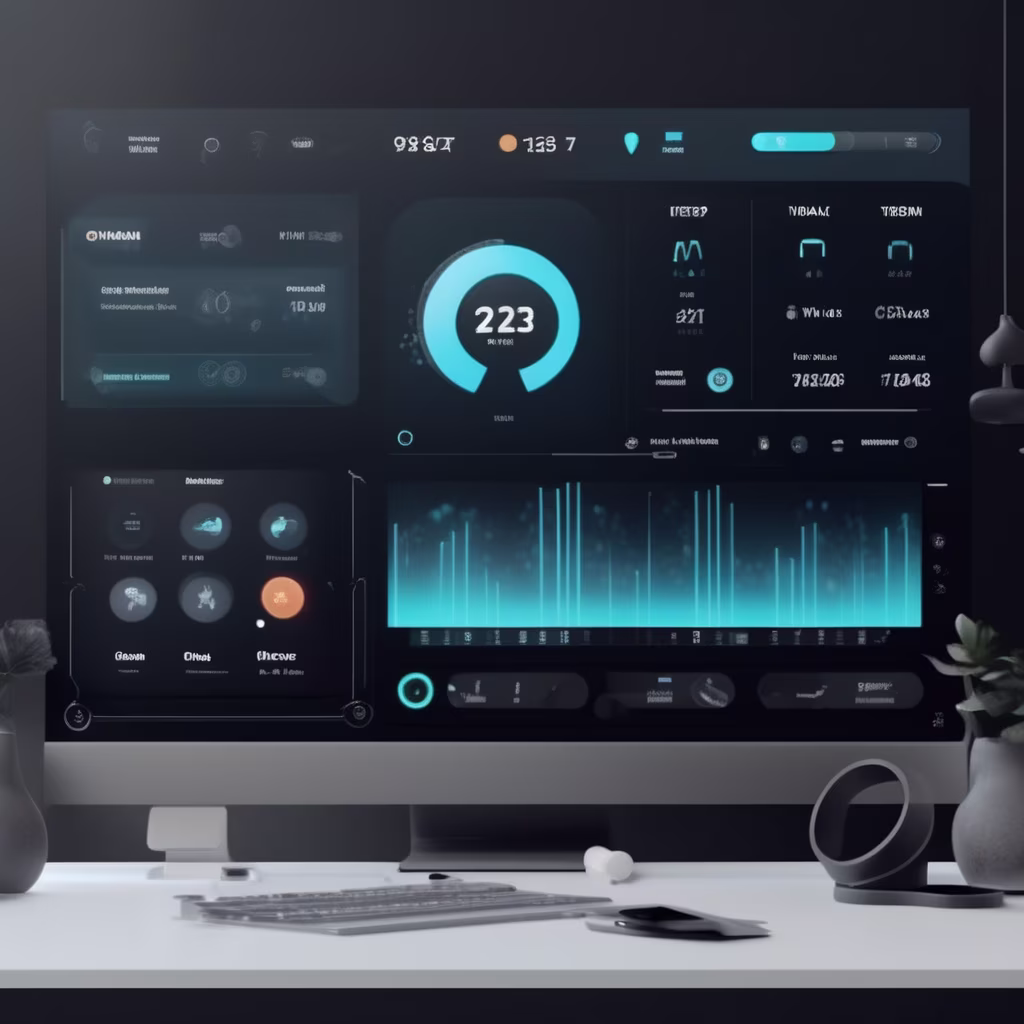
Prompt: Create a futuristic AI-driven dashboard for a smart home system that seamlessly integrates with Internet of Things (IoT) devices, focusing on a sleek and minimalist design with interactive data visualizations.

Prompt: Create an INFORGRAPHY for a personal finance guide that offers practical advice on budgeting, investing, and building wealth. The cover should exude professionalism and financial success. Use sleek and modern design elements with images of currency or financial charts. Include the book title 'Financial Mastery: Wealth Building Strategies' and the author's name 'David P. Finance' on the cover.


