Prompt: 2d cartoon characters, caricatured form, full body head and legs, superhero Black Vulcan (Harvey Birdman), brutal, shining, flashes, splashes, lightning, halo, glow, light rays, against the background of a detailed complex evil dark wonderland, rage, anger, aggression, ready to take on any opponent with his strength and supernatural abilities, strength, power, cartoon scenes, sci-fi, fantasy, action pose, dnd character, DC Comics style, 70s TV series, dark light, vibrant color, high detailed background, high detail, best quality, cartoon, by Jack Kirby, Alex Ross, Giger, Frank Mille, Boris Vallejo
Negative: low quality, low-grade, twins, duplicate, fused finger, missing arm, missing leg, extra finger, poorly drawn hand, poorly drawn face, deformed, bad proportion, cloned face, disfigured, extra limb, bad anatomy, gross proportion, malformed limb,extra legs, extra arms, identical positions, duplicates, repeats, ultra realistic, no expression, blurry, 3d, ugly face, low detail, empty background, out of crop, minimalistic, badly drawn, superman, batman, ironman,
Style: Comic Book






Prompt: create a 2 line graphs in a single chart where the first graph is slightly above the seccond graph and the randomly add some flat lines the graph should also look like matplotlib was used and the title is \"acc vs v-acc\" x_labels = [0, 20, 40, 60, 80, 100, 120, 140] y_labels = [0, 0.65, 0.70, 0.75, 0.80, 0.85, 0.90]
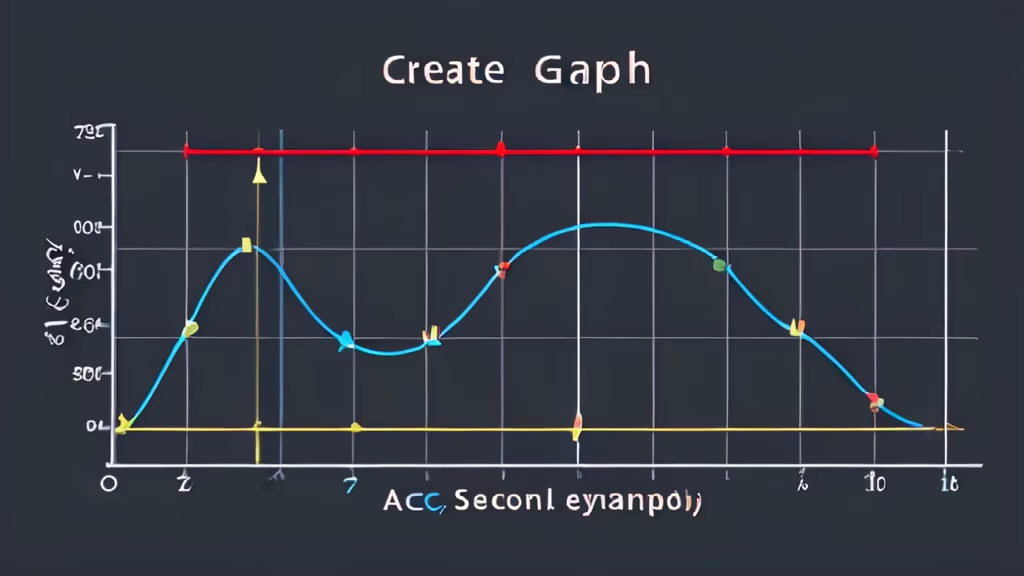


Prompt: Continuous growth of data,Line Chart, Rising Data,white background, Gradual Increase, High Definition, High Pixel, Multiple Keyframes Blurred
Style: Digital Art


Prompt: Extraction of data, flow of data with data points, black and white, icon, material-ui, ux ui, simple, clean lines and shapes, filled shapes
Negative: outlined
Style: Line Art






Prompt: create a visualization infographic to show opportunities and challenges of a low-carbon economy, data visualization, charts, graphs, high contrast, light background








Prompt: dream prompt:create a visualization infographic to show opportunities and challenges of a low-carbon economy, data visualization, charts, graphs, modern design


