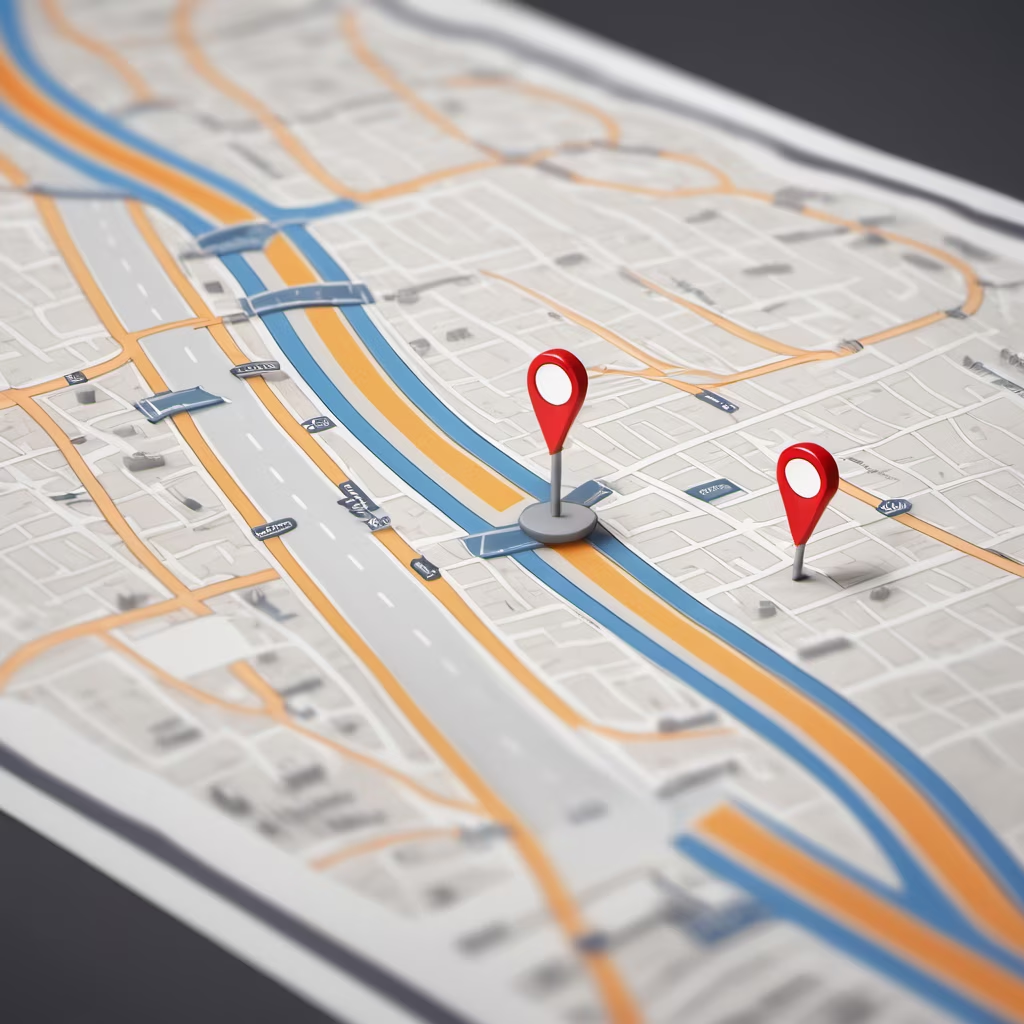
Prompt: Efficient Resource Allocation using Participatory Geographic Information Systems . Showing various different resources allocated on different parts in a map.


Prompt: Imagine a dynamic and vibrant network diagram representing the various stakeholders involved in the services offered by an overseas education agency. The central node could be the agency itself, surrounded by several key nodes representing its main partners, agents, and consultants. From these nodes, lines would radiate out to represent the flow of information and resources between the agency and its partners. On the other side of the diagram, there could be a cluster of nodes representing the students and institutions that the agency serves. These nodes could be connected to the agency through lines representing the educational programs, scholarships, or other services provided by the agency. The overall image should convey a sense of collaboration and mutual benefit among all parties involved, highlighting the agency's role as a facilitator and connector in the global education landscape, modern, high quality, sense of depth, bright colours, 8k, detailed, ultra high definition, 1X upscaled image, UHDR
Negative: nsfw, not safe for work, nudity, low quality, long body, elongated body, blurry, faded, bad focus, raster graphics, profile, bad graphics, bad render, low pixel density, unsharp image, unsharp details, cut-off limbs, ugly hands, deformed hands, deformed arms, deformed legs, twisted fingers, malformed fingers, mutated fingers, deformed fingers, bad proportions, extra limbs, extra limb, poorly drawn, gross proportions, mutation, mutated limbs, text, signature, title, watermark, poster, cover, big nose, double body, multiple people, two people, multiple heads, 3 arms, 4 arms, out of frame, cropped, cartoonish, smooth, texts, words, numbers, letters, signatures, watermarks, canvas, frames, extra fingers
Style: Photographic


Prompt: This visual tool effectively communicates the importance of understanding the source and origin of advancements, encouraging a comprehensive comprehension of the journey leading to the final technological outcome.


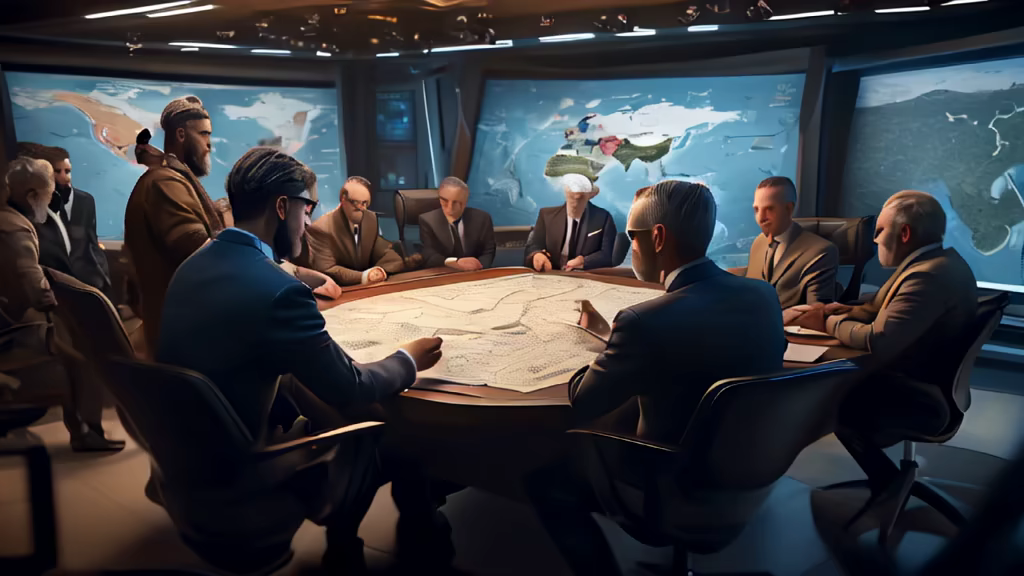
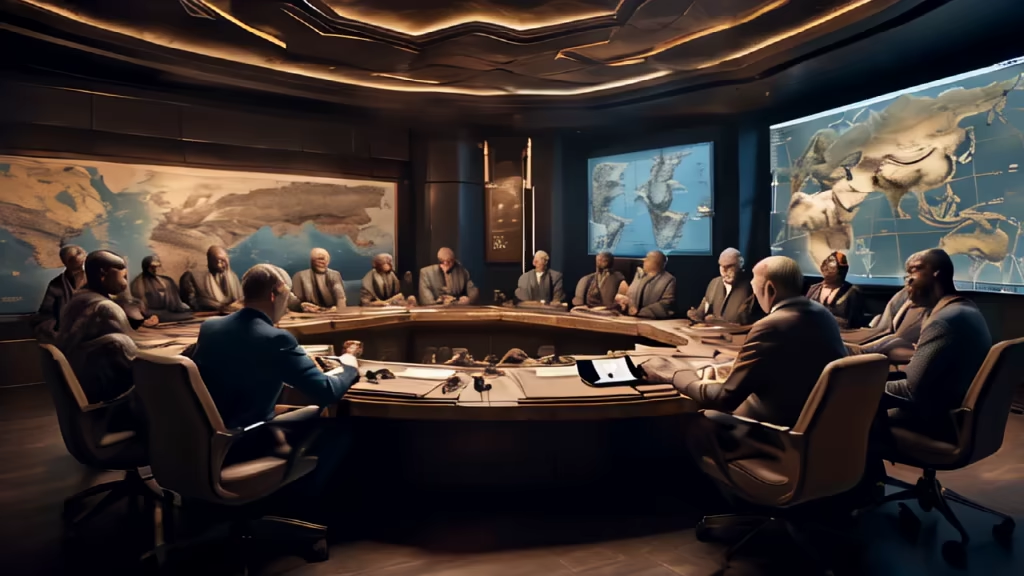
Prompt: Visualize the key characters huddled in a war room, maps and battle plans spread out before them. Capture the intensity of the strategic discussions and decision-making during the mid-journey.
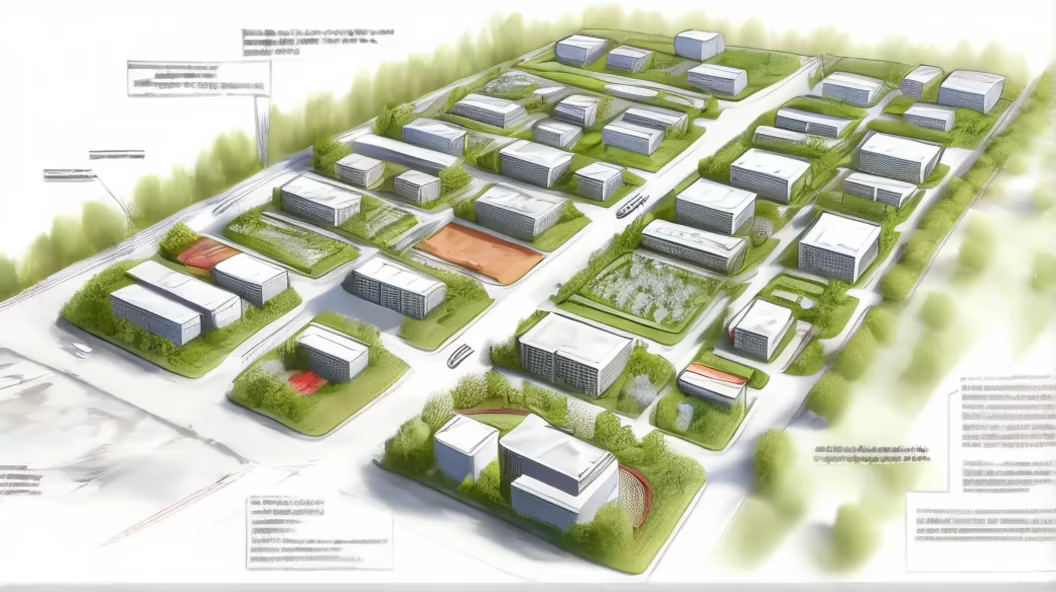
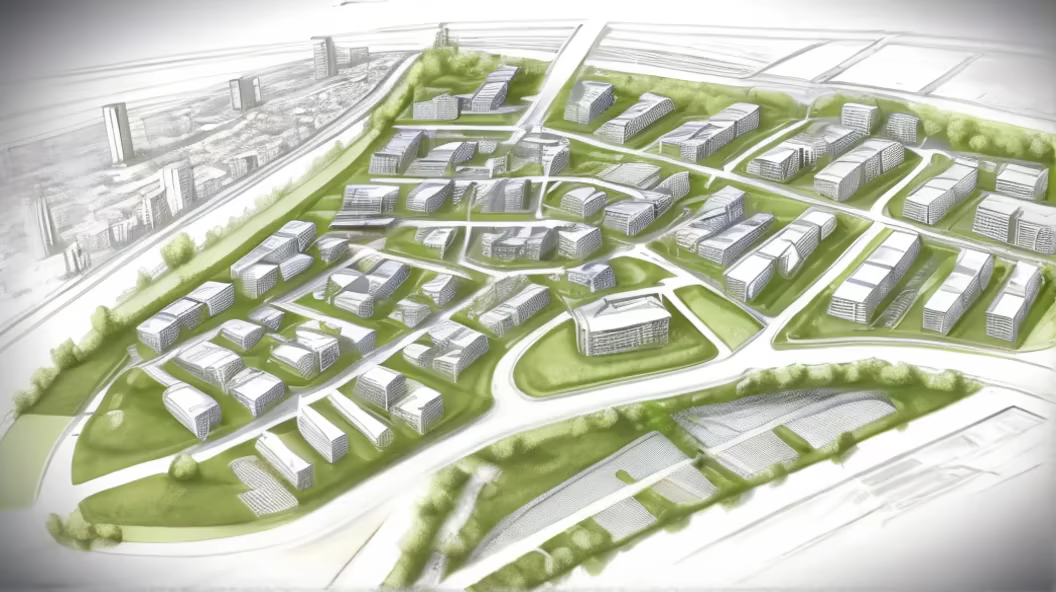
Prompt: We have a sketch of a city plan, which includes residential, commercial, and industrial land uses. We also have some information about the surrounding environment of the area, such as population density, traffic flow, and pollution levels. We can also provide some human directives, such as our desire to increase green space and reduce traffic congestion in the area.
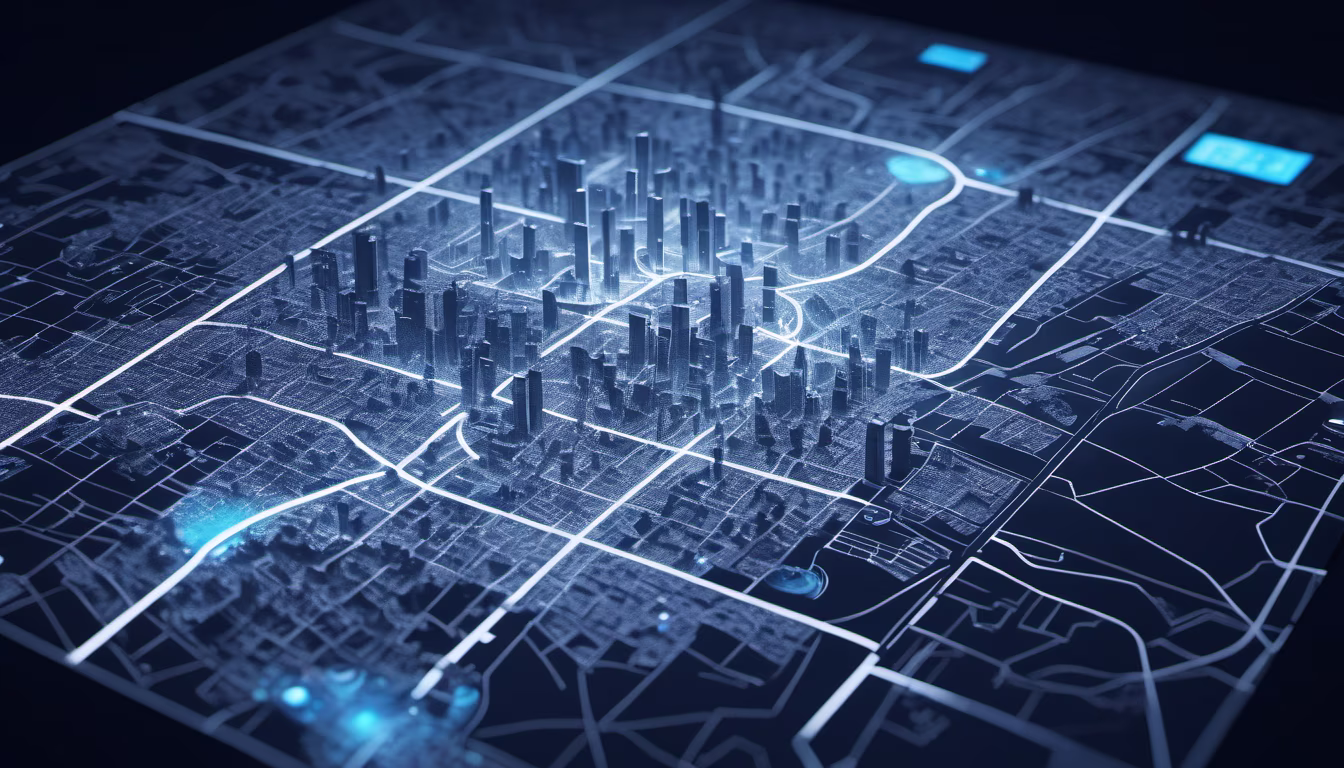
Prompt: Technology visualization screen, city planning map, sense of technology, sense of the future


Prompt: Based on the input of physical cluster information and model structure, the spatial modeling of load segmentation optimization is carried out, and the optimized segmentation deployment strategy is searched through multiple iterations of policy generation, policy application and performance simulation


Prompt: map, landscape design, architectural design, preliminary analysis, road analysis, archdaily, fine texture, low saturation,


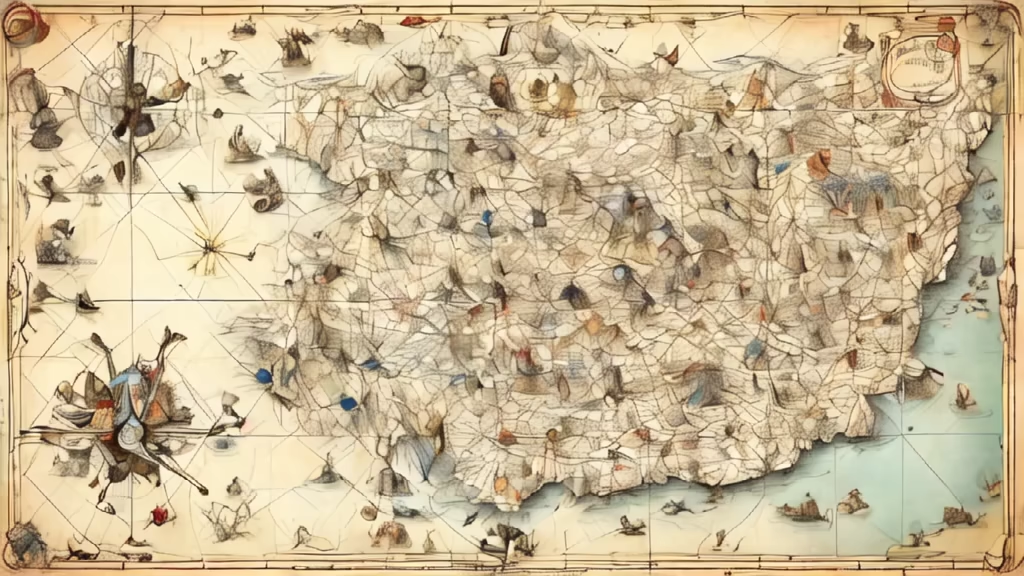
Prompt: A complex but beautiful landscape map, the picture hides 8 faces, but these 8 faces are well integrated in the landscape, so that people can not see easily


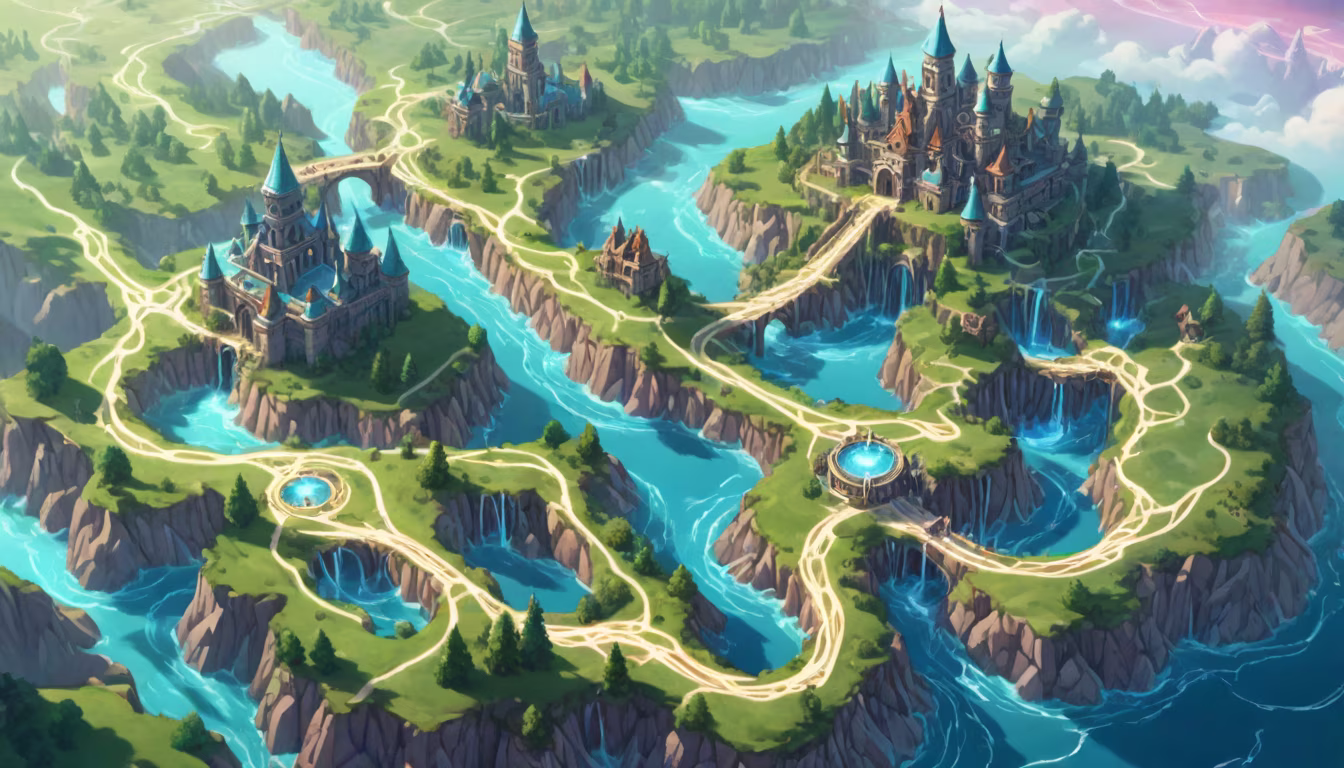
Prompt: Envision an expansive overworld map, resembling an intricate network of interconnected paths and branching routes. The traditional linear progression is replaced by a labyrinthine design, where levels are scattered like landmarks across the terrain. The paths meander through diverse landscapes, each representing a distinct style of gameplay content. Instead of a linear difficulty curve, the map conveys the idea of a player choosing different routes, encountering varied challenges that aren't necessarily more difficult but offer a unique flavor to the gameplay experience.
Style: Fantasy Art


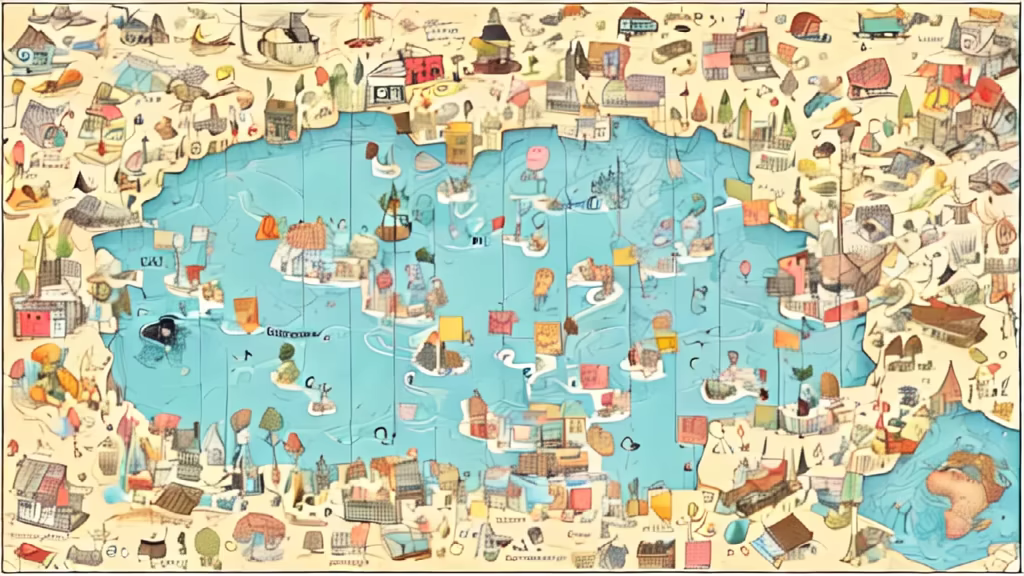
Prompt: Imagine an image of a dynamic, abstract game environment characterized by interconnected pathways and nodes, resembling a sprawling, chaotic network. The nodes represent various aspects of the game—missions, metagame elements, and open-world exploration. Each pathway symbolizes the multiple, diverse ways players can approach and navigate through the game. Random elements, depicted as vibrant bursts of color, permeate the environment, reflecting the embrace of chaos and the unexpected. The landscape suggests the influence of physics, with momentum-driven gameplay evident in the fluid, non-linear design. A level select screen seamlessly integrates with the open-world concept, providing a visual representation of the expansive choices available to the player.


Prompt: `8-bit Pixel art, large pixels gorgeous blonde woman dancing with 2 daughters, bright lime green clothing, super low res,`Style: `Pixel Art`


Prompt: Imagine an intricate digital tapestry displayed on a computer screen, illustrating the nuanced process of randomization. At the forefront, a dynamic flowchart unfolds, showcasing a sequence of logical steps. The tapestry commences with the random generator delving into the parameters of the level's general and ambient environment, symbolized by nodes representing environmental factors. As the generator navigates through subsequent nodes, it distinguishes common occurrences, depicted by vibrant pathways, from less frequent actions illustrated by narrower trails. Anomalies, representing rare outcomes, emerge as ethereal bursts of color, emphasizing their scarcity. The tapestry not only visually encapsulates the meticulous structure but also conveys a sense of purpose and meaning behind the randomness, turning a seemingly chaotic process into an artful and purposeful creation.


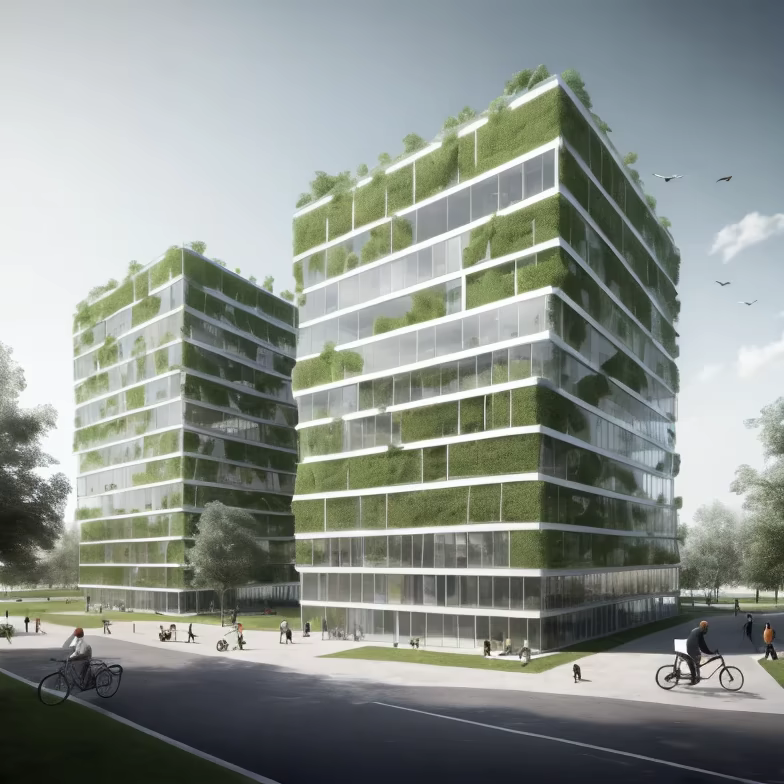
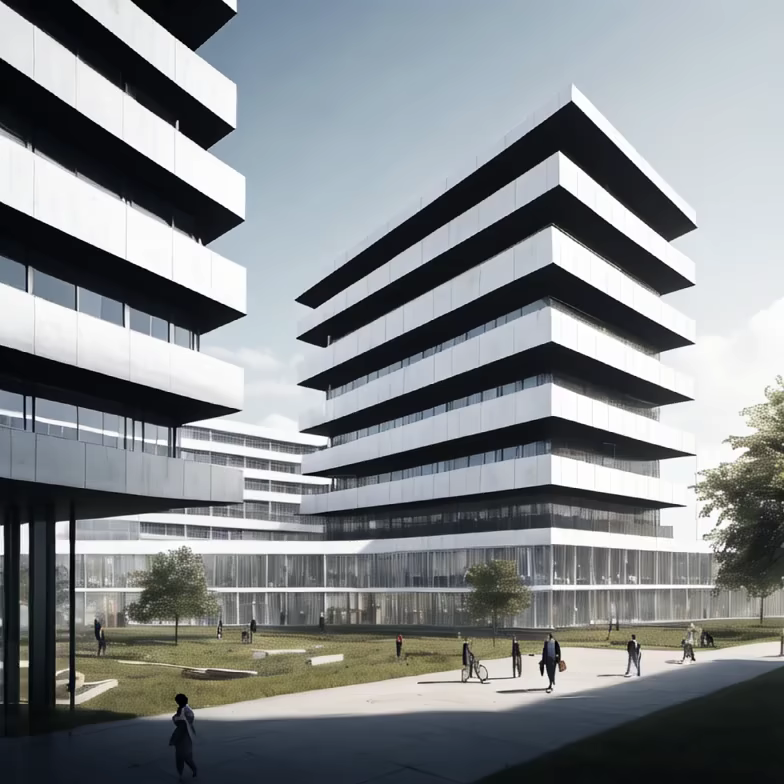
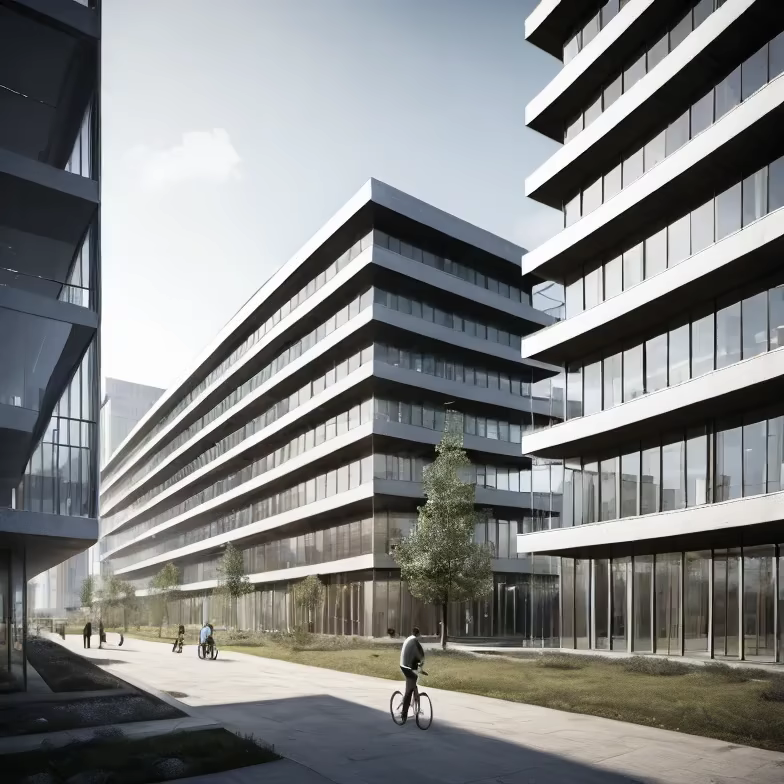
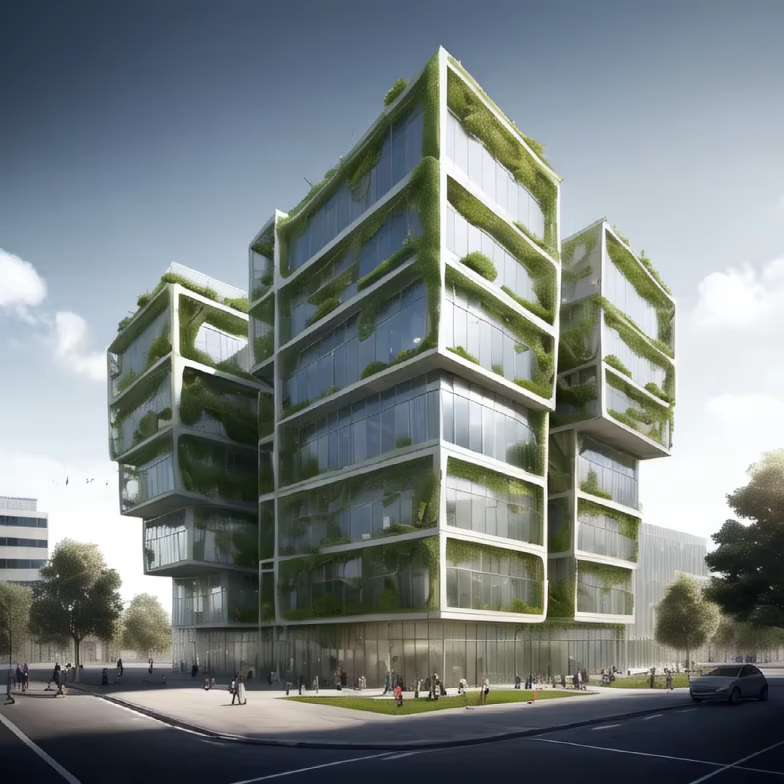
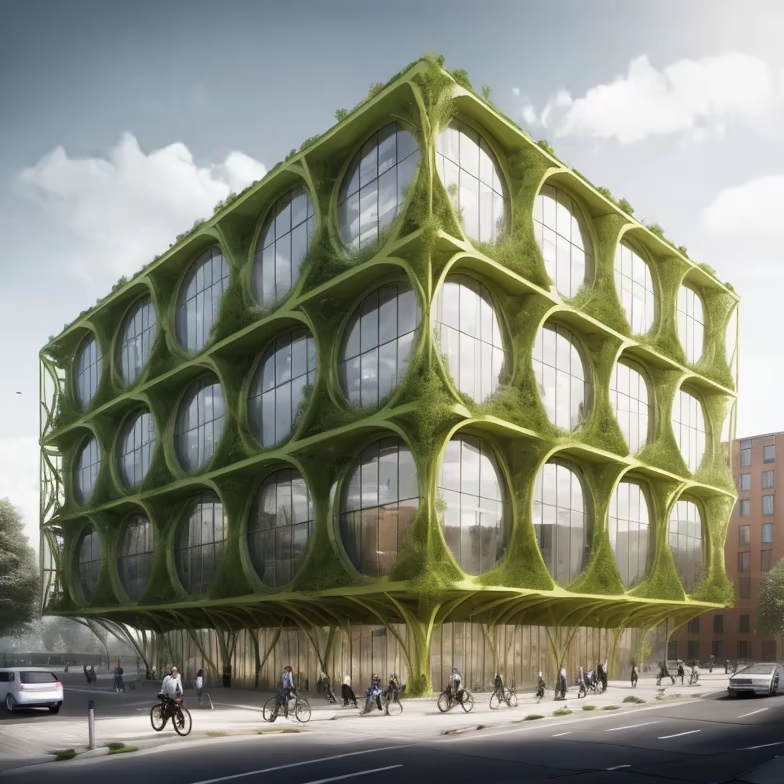
Prompt: Office, housing, education and research buildings. which are complex, standardized, centralized structures dependent on external systems, such as energy, water and transport. The office building is vulnerable to failures, interruptions and obsolescence, and cannot easily adjust or renew itself. Here the idea is that just like in agribusiness, buildings are closed cycle structures that eliminate external systems and make it a closed cycle. , from energy to water, from housing to employment. optimize time so that it can be used in other ways.


Prompt: Office, housing, education and research buildings. which are complex, standardized, centralized structures dependent on external systems, such as energy, water and transport. The office building is vulnerable to failures, interruptions and obsolescence, and cannot easily adjust or renew itself. Here the idea is that just like in agribusiness, buildings are closed cycle structures that eliminate external systems and make it a closed cycle. , from energy to water, from housing to employment. optimize time so that it can be used in other ways.
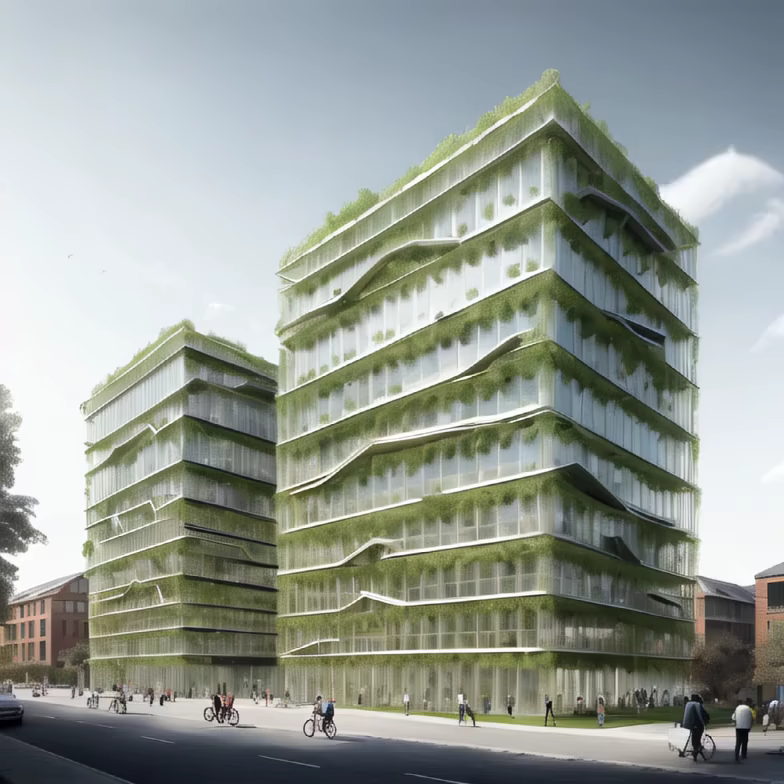


Prompt: Picture a fluid mosaic of interconnected pathways and bridges, representing the streamlined systems. The mechanics are symbolized by a series of interconnected, smooth-flowing channels, highlighting the seamless flow of operations. User-friendly controls are illustrated through intuitive touchpoints, emphasizing the ease of navigation. Best practices in interface design manifest as clear signposts and markers along the pathways, guiding users with simplicity. Important information is displayed prominently, akin to well-lit landmarks in the visual landscape.


Prompt: this is city traffic map. it must have minimalist and futuristic design aesthetics. it should also contain white as base color green and blue accents.


Prompt: A male teenager, dressed in black clothing, wearing a bamboo conical hat, is using a hoe to dig bamboo shoots


Prompt: a realistic zombie horde, very detailed, no background, detailed faces and bodies
Style: Cinematic


Prompt: Design a technological large screen background that incorporates elements of water environment, water resources, and water ecology.


Prompt: Mapping a digitally transformed future, reflecting key technology elements such as IoT, cloud computing, big data, AI, etc.


Prompt: generate a large city of 16 km2 , made out of 26000 buildings that have a maximum of 2 floors. The city is located within a squarish site boundary . Take the image of the city from a top view or aerial view .


Prompt: this is city map. it must have minimalist and futuristic design aesthetics. it should also contain white as base color green and blue accents.


Prompt: Envision an expansive overworld map, resembling an intricate network of interconnected paths and branching routes. The traditional linear progression is replaced by a labyrinthine design, where levels are scattered like landmarks across the terrain. The paths meander through diverse landscapes, each representing a distinct style of gameplay content. Instead of a linear difficulty curve, the map conveys the idea of a player choosing different routes, encountering varied challenges that aren't necessarily more difficult but offer a unique flavor to the gameplay experience.
Style: Line Art


Prompt: Data repositories, knowledge graph, semantic indexing, blue data visualization, information architecture, comprehensive datasets, deep learning analytics, cognitive computing, domain-specific insights, ontology mapping, structured knowledge, interconnected data nodes, blue-themed data mining, in-depth data curation, contextual data representation, graph-based knowledge storage, comprehensive data catalog, blue spectrum information retrieval, robust data ecosystem, knowledge enrichment.


Prompt: Data repositories, knowledge graph, semantic indexing, blue data visualization, information architecture, comprehensive datasets, deep learning analytics, cognitive computing, domain-specific insights, ontology mapping, structured knowledge, interconnected data nodes, blue-themed data mining, in-depth data curation, contextual data representation, graph-based knowledge storage, comprehensive data catalog, blue spectrum information retrieval, robust data ecosystem, knowledge enrichment.


Prompt: Data repositories, knowledge graph, semantic indexing, blue data visualization, information architecture, comprehensive datasets, deep learning analytics, cognitive computing, domain-specific insights, ontology mapping, structured knowledge, interconnected data nodes, blue-themed data mining, in-depth data curation, contextual data representation, graph-based knowledge storage, comprehensive data catalog, blue spectrum information retrieval, robust data ecosystem, knowledge enrichment.