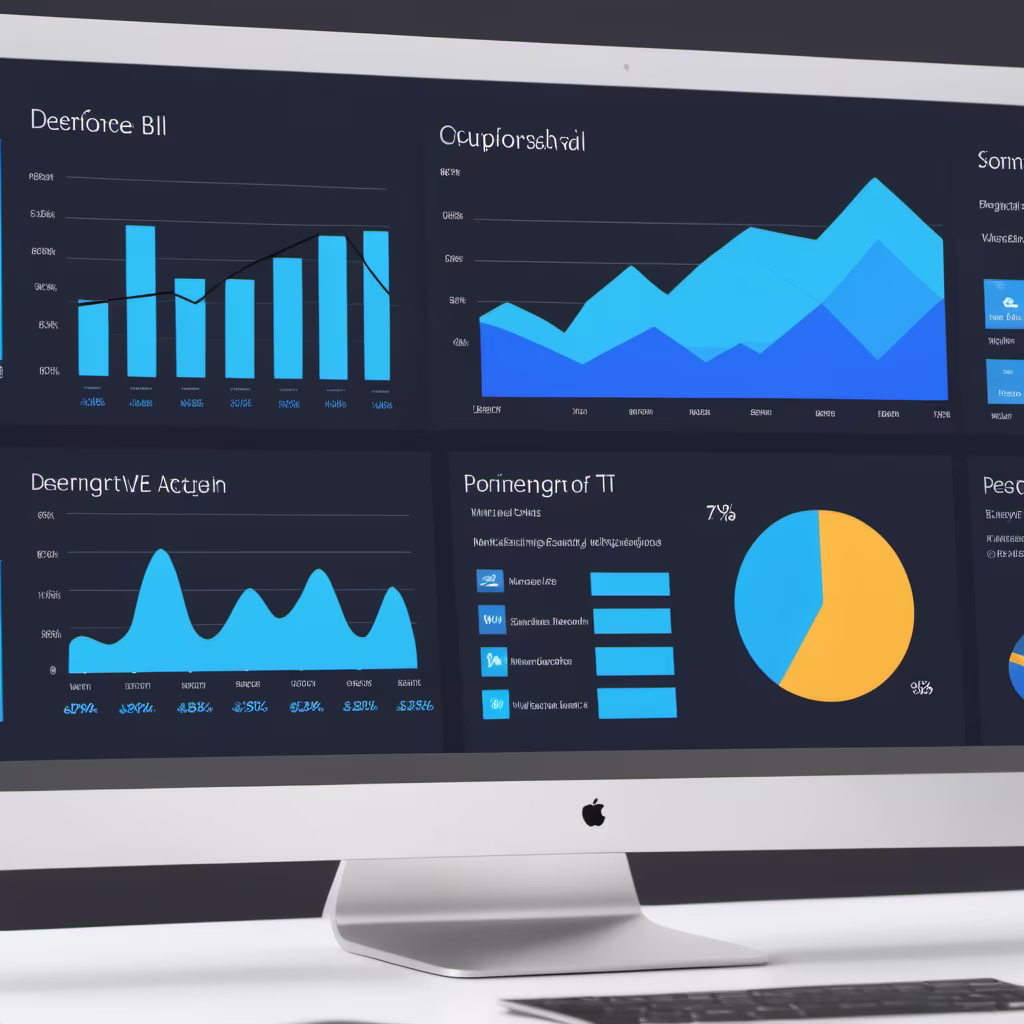
Prompt: Generate a dashboard for Microsoft, highlighting revenue from different business segments and cloud services usage.\"


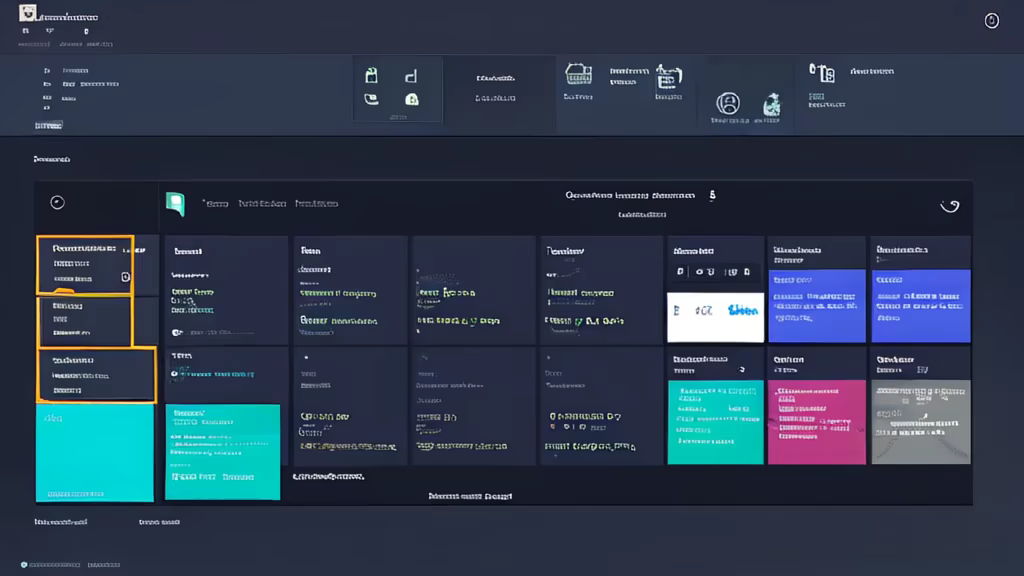


Prompt: create a dashboard for portfolio details page with most useful kpis. In this page we will displaying the list of stocks that are added to the portfolio


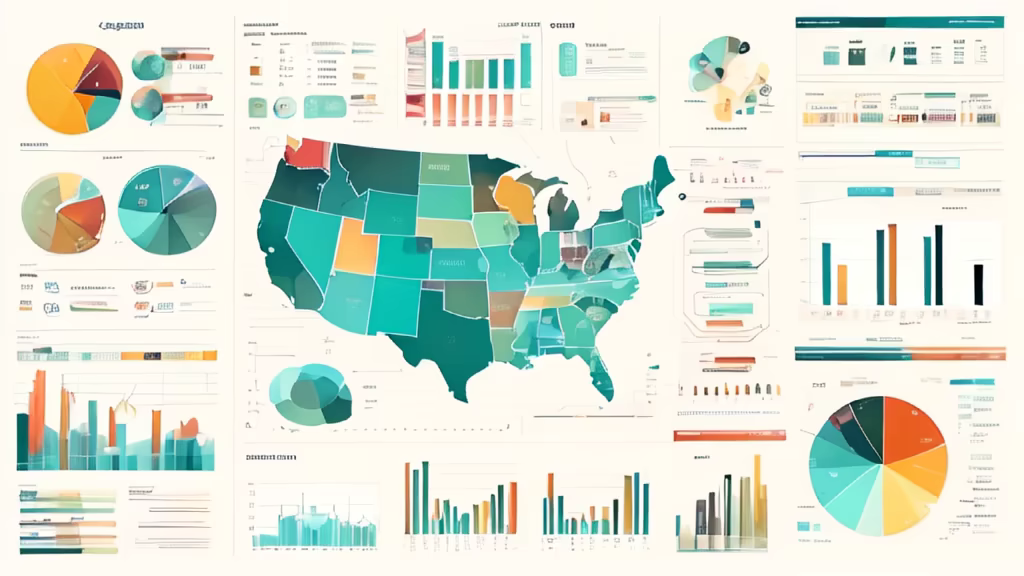
Prompt: \"Market Overview - Create an informative visual representation of a market overview. The image should convey key data, trends, and insights about a specific market or industry. Medium: Visual market overview representation. Style: Choose a style that communicates professionalism and data-driven insights. Resolution: High-quality to ensure clarity of data. --ar 16:9 --v 5.1 --style informative --q 2 --s 750.
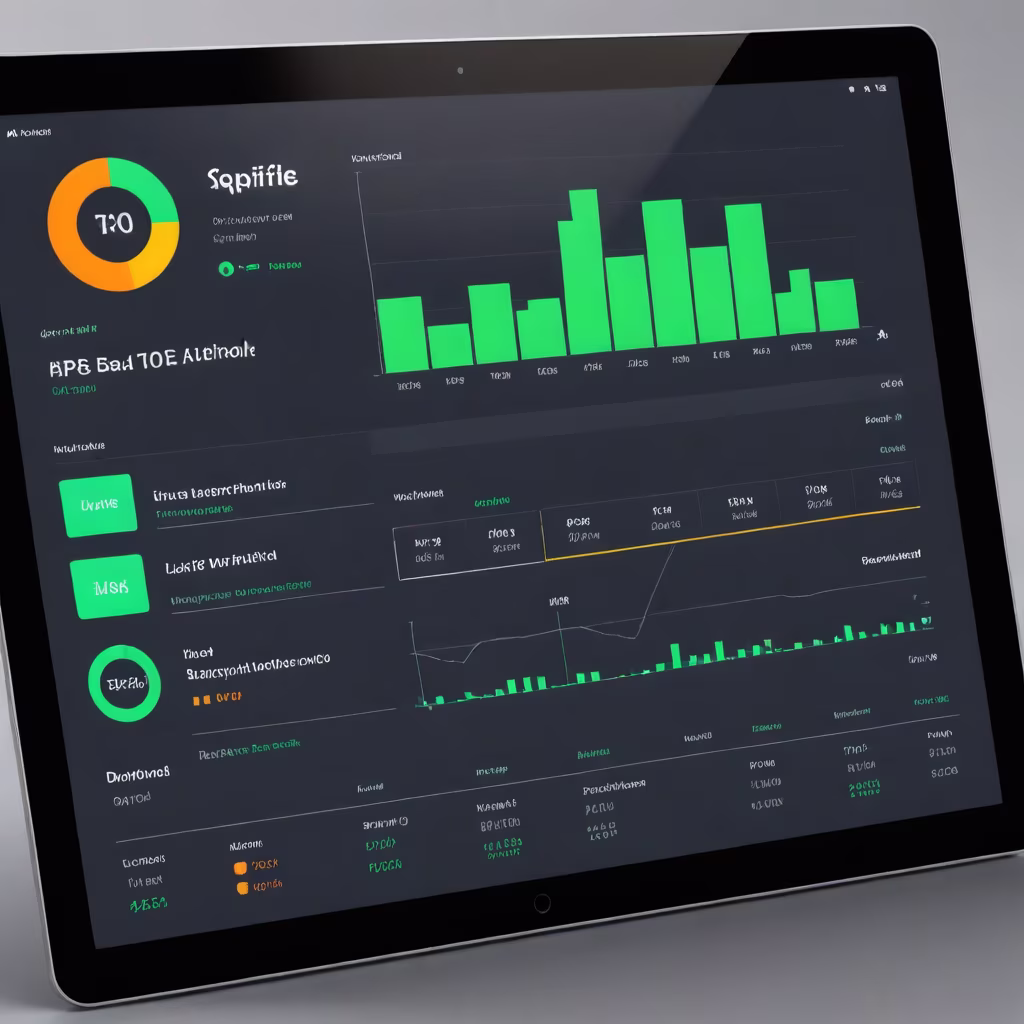
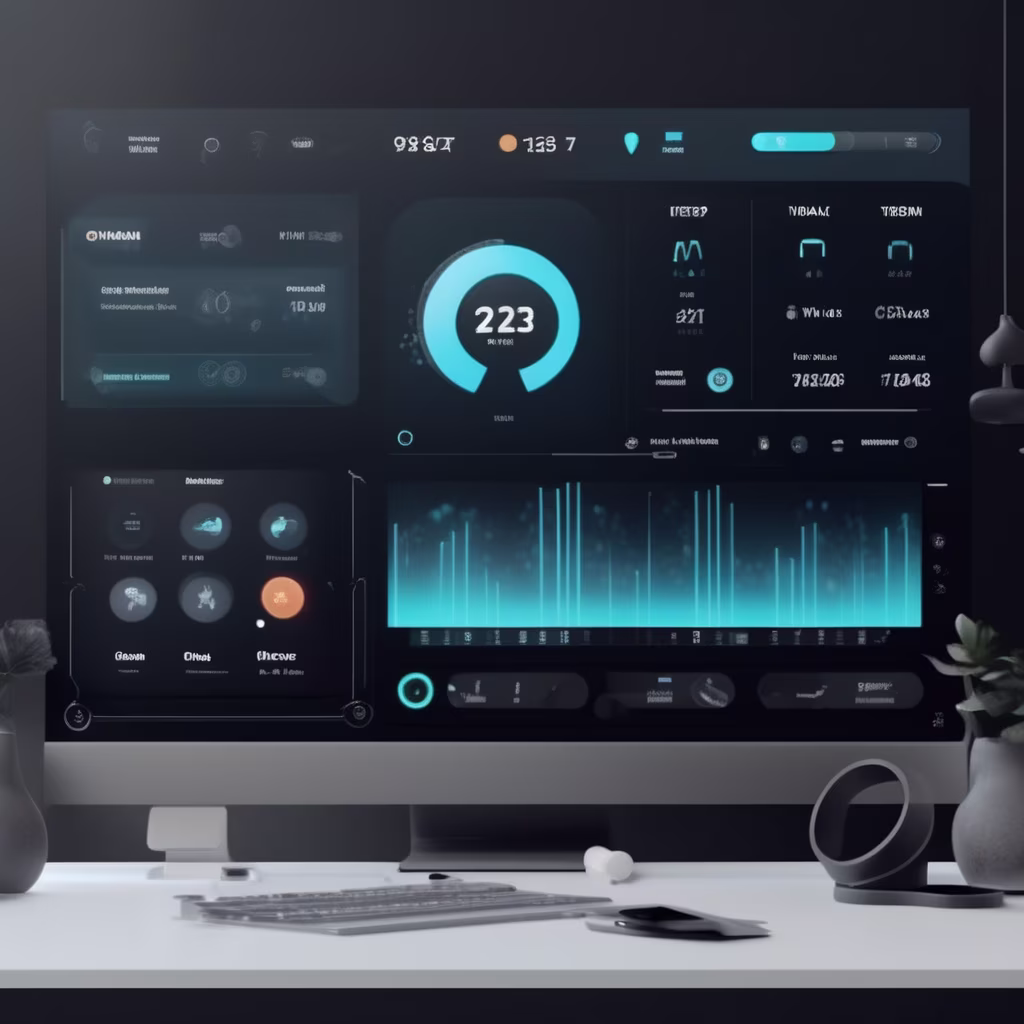
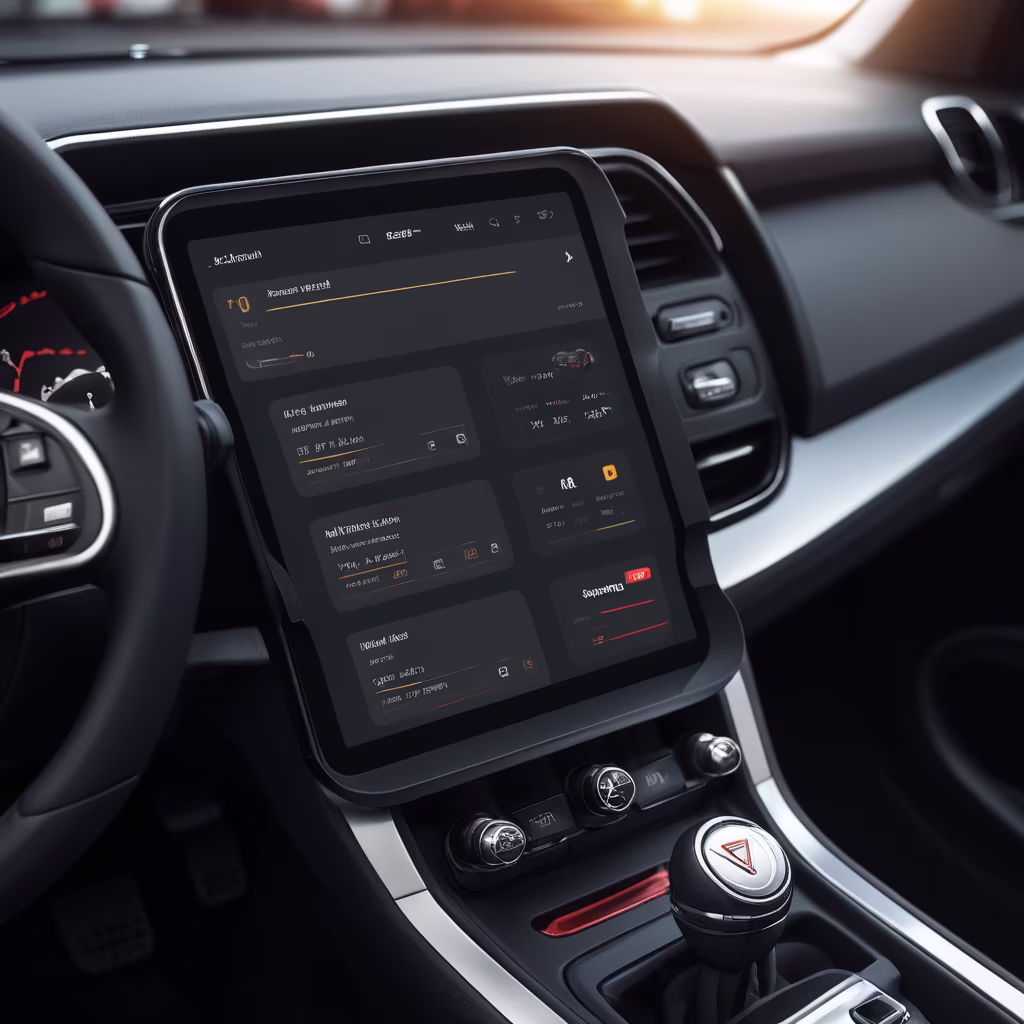
Prompt: Create a futuristic AI-driven dashboard for a smart home system that seamlessly integrates with Internet of Things (IoT) devices, focusing on a sleek and minimalist design with interactive data visualizations.

Prompt: Google Cloud BigQuery real time streaming capability with the help of continuous query updating the end user dashboard automatically


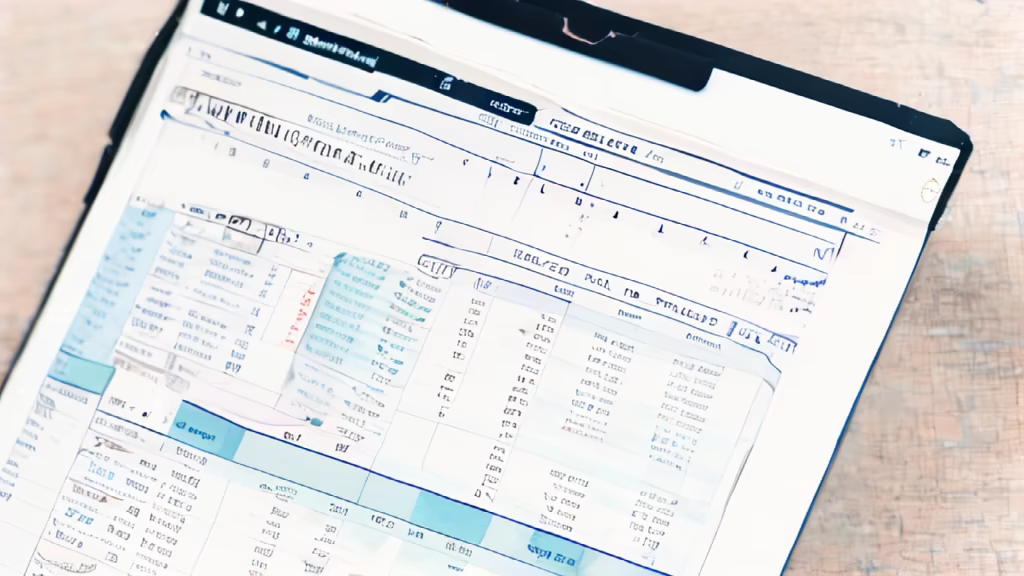
Prompt: A cutting-edge software interface displaying medical data exploration. The focal point is a dynamic display of patient information with interactive features, cg, high-tech, sleek, user-friendly, interactive, illuminated, transparent overlays, holographic elements.


Prompt: Graphic displaying financial data analysis with AI, AI-powered banking or fintech apps, or professionals working in the finance sector with AI technologies.


Prompt: Create a visual comparison chart illustrating the differences between HDDs and SSDs, showcasing factors such as speed, capacity, and form factor.
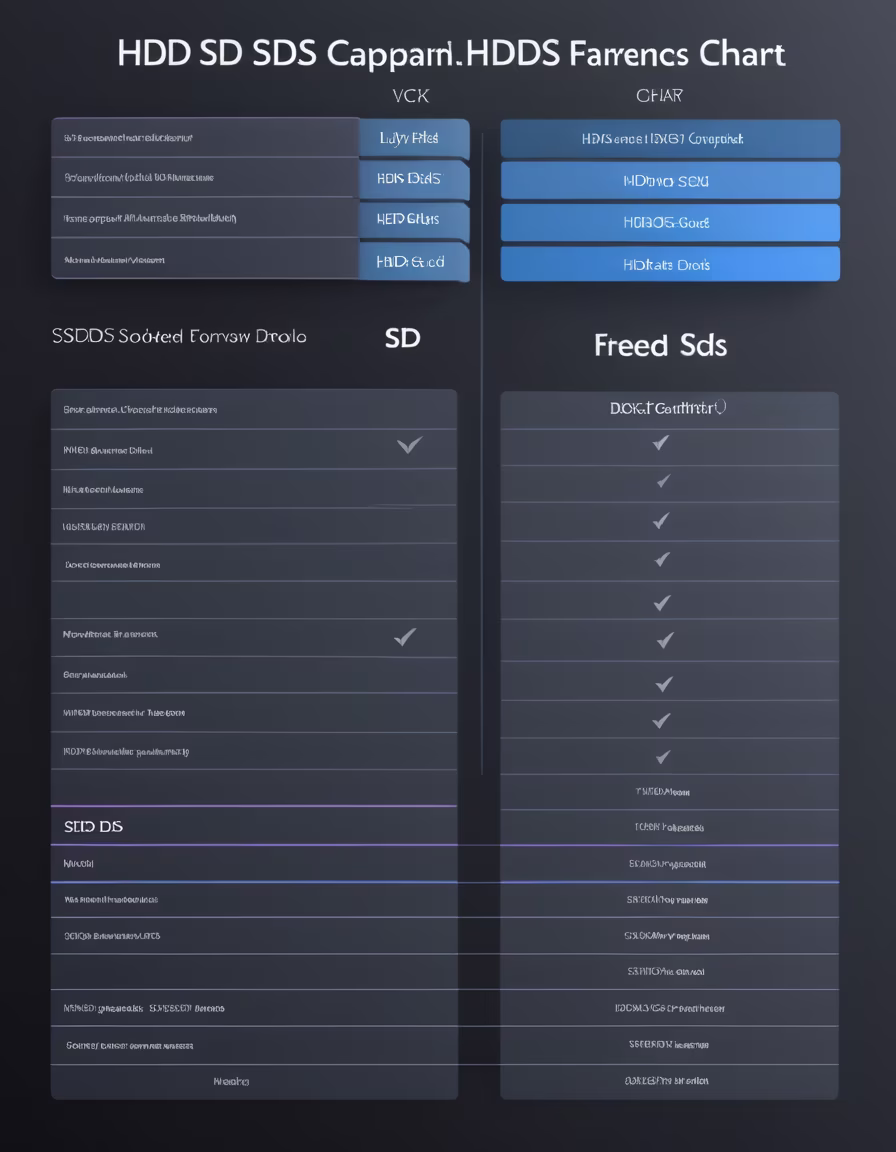

Prompt: Create a visual comparison chart illustrating the differences between HDDs and SSDs, showcasing factors such as speed, capacity, and form factor.

Prompt: Key offerings of Appkube, 360-degree view of your multi cloud environment, ML-powered recommendations and automated actions, Historical cost trend comparisons, Real-time waste detection and cost spike resolution, Cost alignment with business outcomes.


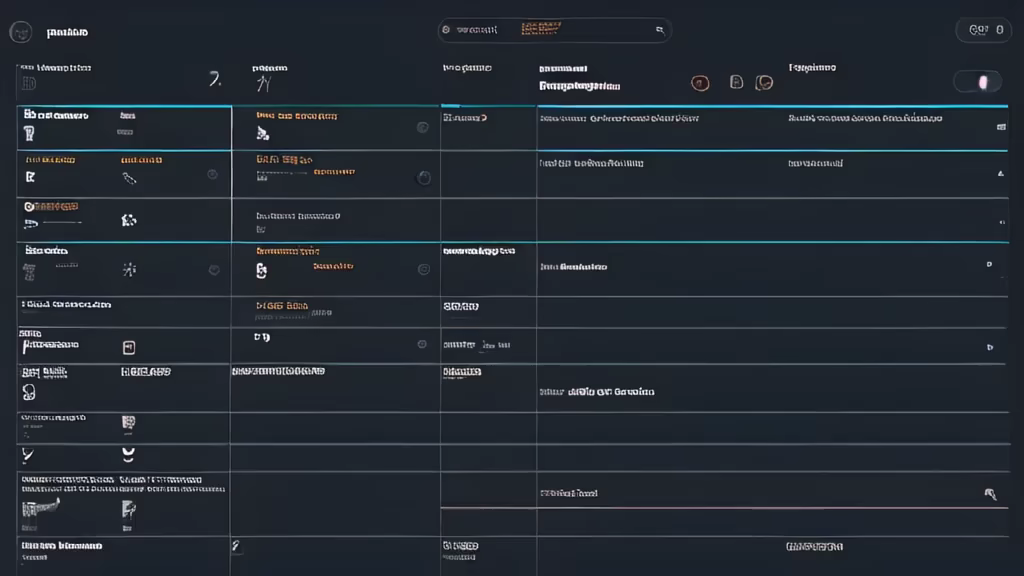
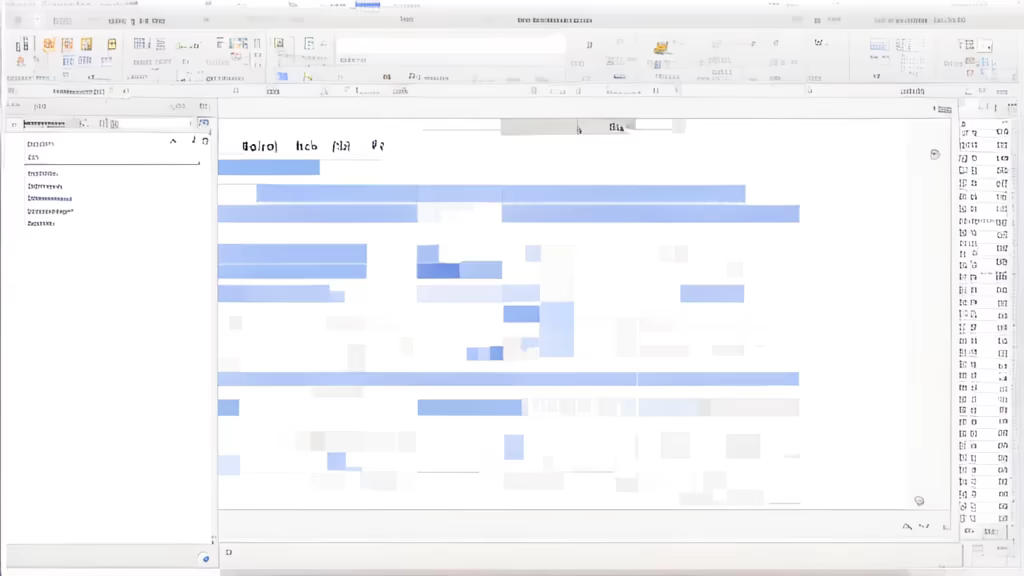
Prompt: In this screenshot of the software's functionality, we can see an intuitive and powerful user interface specifically designed to handle patient data. Below are the key features highlighted: Retrieving Patient Data: Users can retrieve patient data using the search function, which is displayed on the main interface. Secondary Field Search: The software supports secondary field searches on the retrieved patient data results. Users can select specific fields and enter relevant search criteria. Display column click function: By clicking on any display column, users can carry out more refined data filtering and secondary search operations. Refined Data Filtering: Users can filter to specific field value ranges or value ranges. This provides more flexible data handling options. This screenshot shows the intuitive interface of the software when processing patient data, allowing users to easily perform secondary searches and refined data filtering.


Prompt: Design a web page interface where users can seamlessly choose between two services - one tailored for professionals and the other for individuals. Create an intuitive layout with clear sections for each category. Utilize a harmonious color scheme, modern typography, and interactive elements to enhance the user experience. Ensure the design is visually appealing and user-friendly


Prompt: Generate a user interface design for a portfolio website that embodies a clean and detailed aesthetic. Consider incorporating modern design elements, intuitive navigation, and visually appealing graphics to enhance the overall user experience. Provide a desktop and mobile version to ensure a seamless transition between devices. Focus on showcasing the individual's skills and achievements in a visually compelling manner while maintaining a minimalist and professional look


Prompt: Generate an image that visually represents the importance of diversifying a financial portfolio. The concept is that it's crucial not to put all your money in a single project. Some projects may not move at all, and money is always rotating. Use creative visuals to convey the idea of spreading investments across various assets for a well-balanced and resilient portfolio.


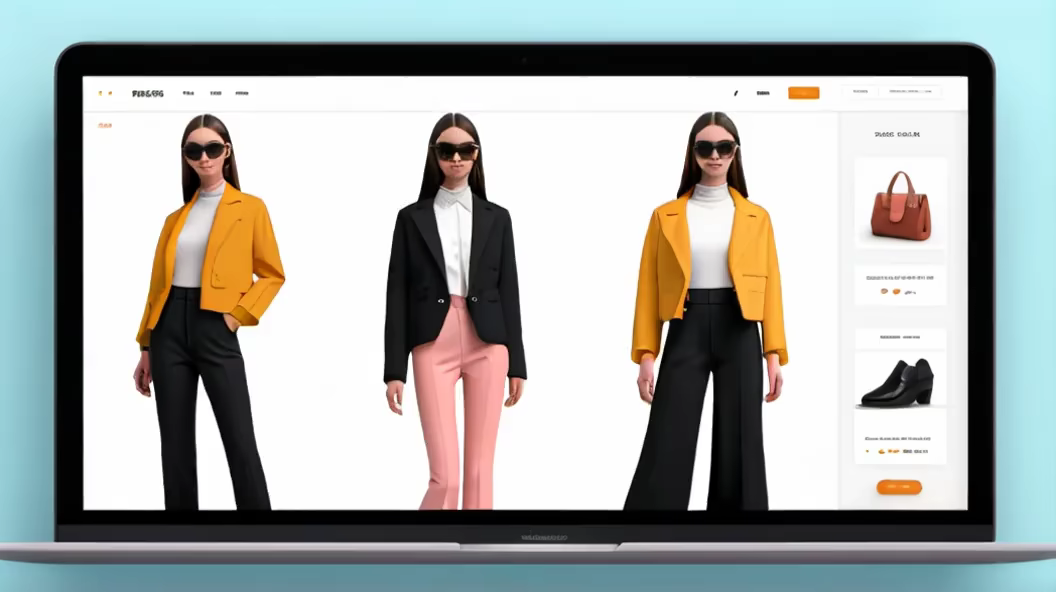
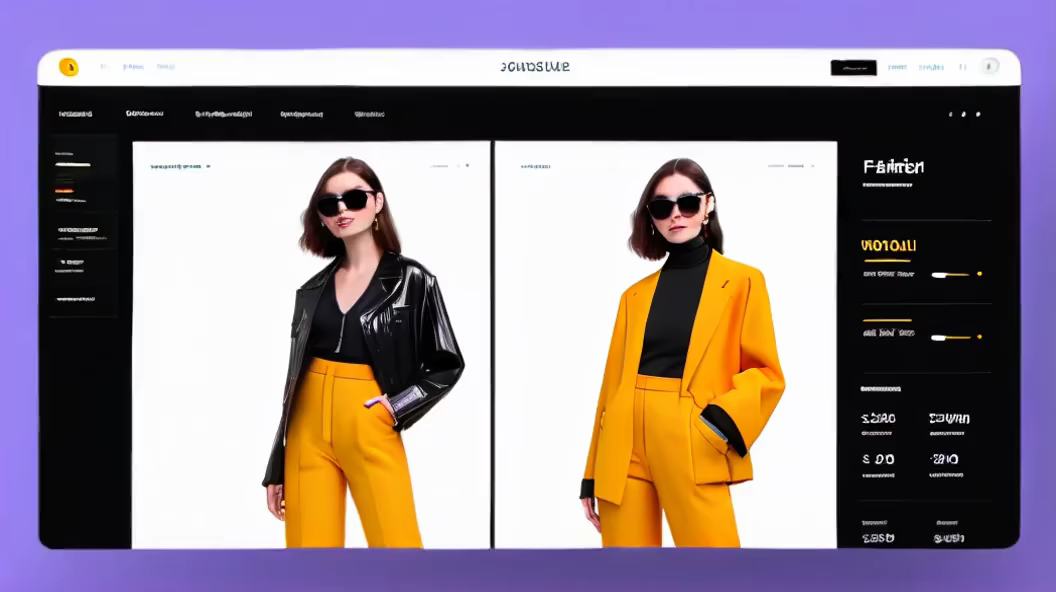
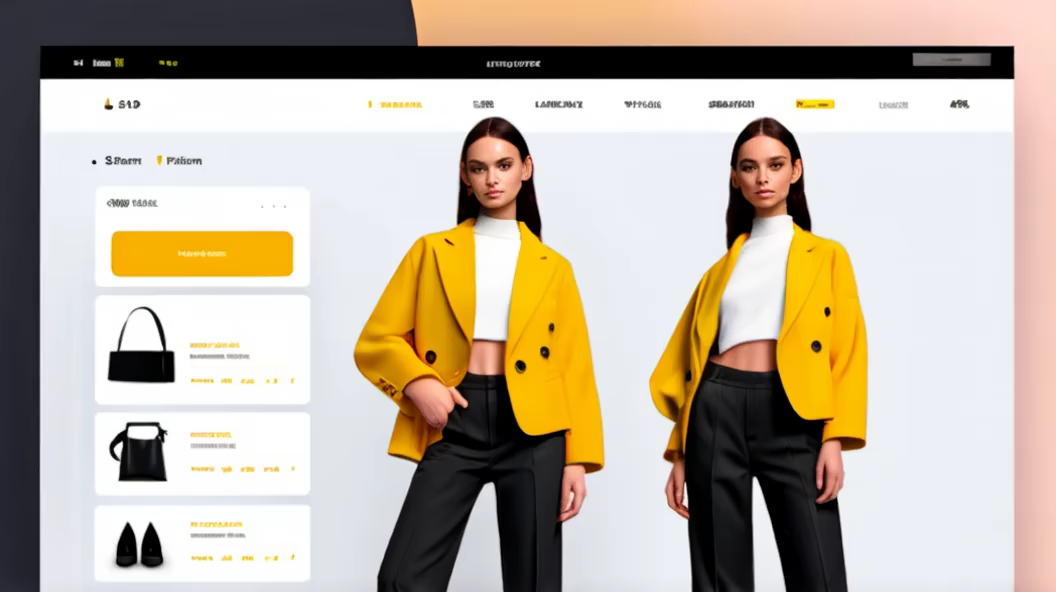
Prompt: a 3d ecommerce website dashboard which shows fashion in next level 3d animations, styles and fonts
Prompt: dream prompt:create a visualization infographic to show opportunities and challenges of a low-carbon economy, data visualization, charts, graphs, modern design


Prompt: A male teenager, dressed in black clothing, wearing a bamboo conical hat, is using a hoe to dig bamboo shoots


Prompt: a realistic zombie horde, very detailed, no background, detailed faces and bodies
Style: Cinematic


Prompt: Technology visualization screen, city planning map, sense of technology, sense of the future


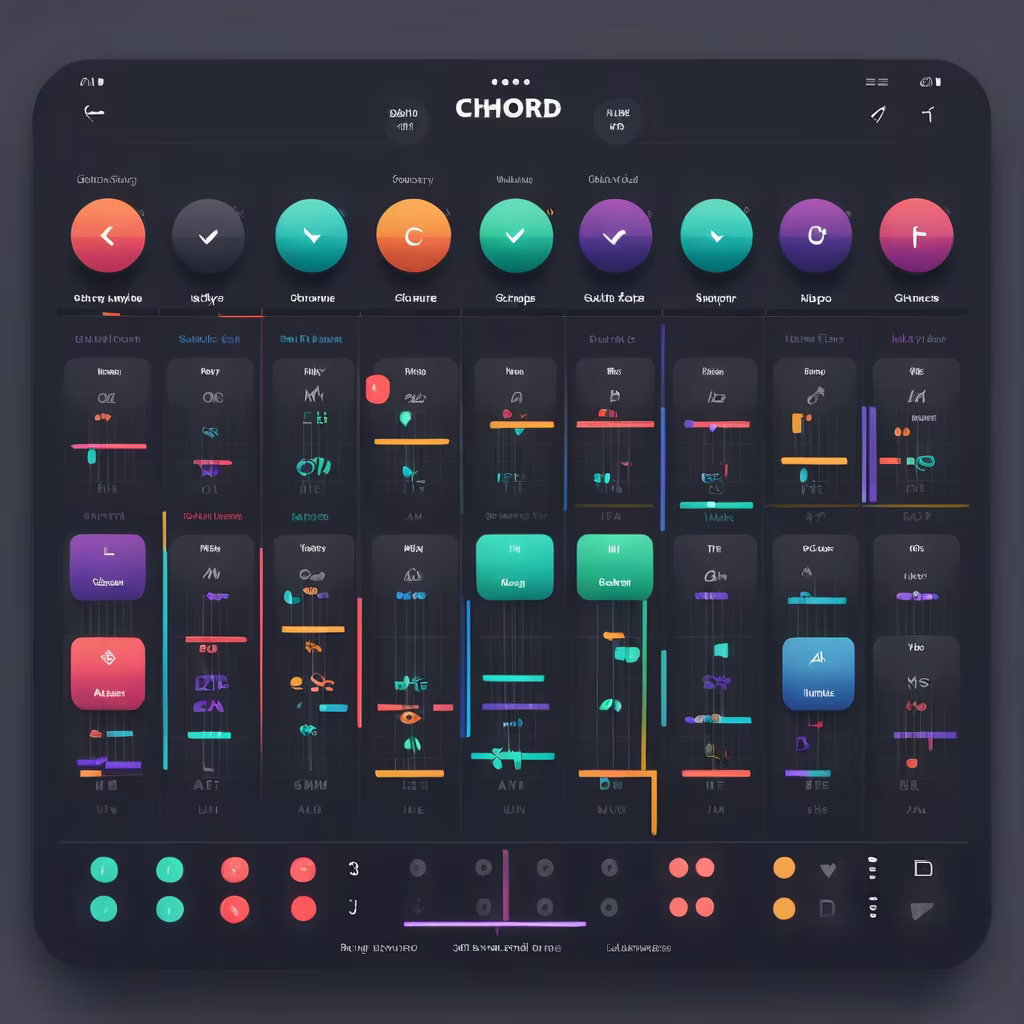
Prompt: Design a simple home screen that displays all the chord charts, sorted by note or chord type. Use intuitive ICONS or colors to enable users to quickly find chords they are interested in


Prompt: Generate a graphic illustrating the timeline of a cybersecurity breach discovery, highlighting key dates and times, and depicting initial response actions.


Prompt: Generate an image showing the development trend and market size of the integrated circuit industry at home and abroad, including some chip production, sales, market share and other data, as well as some maps and charts, the style of business statistics, the color is yellow and blue, the background is white.


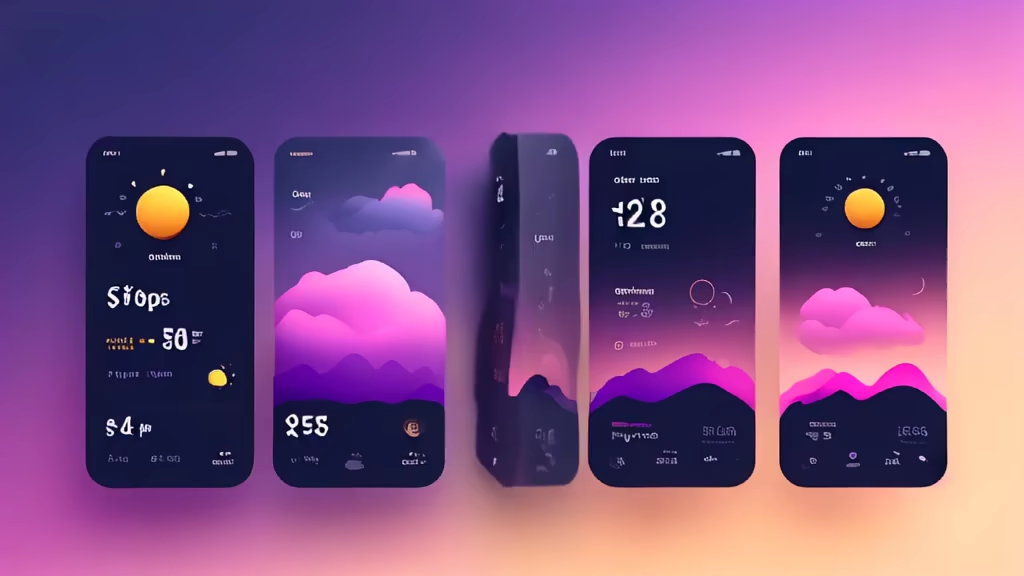
Prompt: an air filter app mobile interface for a different functions and buttons on it UI/UX, minimalist with logo and charts, functionality, stylist


Prompt: Data repositories, knowledge graph, semantic indexing, blue data visualization, information architecture, comprehensive datasets, deep learning analytics, cognitive computing, domain-specific insights, ontology mapping, structured knowledge, interconnected data nodes, blue-themed data mining, in-depth data curation, contextual data representation, graph-based knowledge storage, comprehensive data catalog, blue spectrum information retrieval, robust data ecosystem, knowledge enrichment.


Prompt: Data repositories, knowledge graph, semantic indexing, blue data visualization, information architecture, comprehensive datasets, deep learning analytics, cognitive computing, domain-specific insights, ontology mapping, structured knowledge, interconnected data nodes, blue-themed data mining, in-depth data curation, contextual data representation, graph-based knowledge storage, comprehensive data catalog, blue spectrum information retrieval, robust data ecosystem, knowledge enrichment.

