Prompt: A machine learning model diagram with blue and green nodes and arrows, in the style of a sketch, on a white background
Prompt: Simple lines like electrical circuits on a clean white background. Shades of blue and green add a technological edge, while images of resistors and molecules add a scientific touch to the design. Light highlights add movement


Prompt: steering wheel icon, simple colors, shades of green and dark ocean blue, sketch, futuristic, interface, schematic representation, monotone white background


Prompt: steering wheel icon, simple colors, shades of green and dark ocean blue, sketch, futuristic, interface, schematic representation


Prompt: Flowchart, with various icons, 3D, flowing lines between various icons, UI design, green tone, various data BI analysis, digital twin


Prompt: Ethereal Mechanics' depiction of DNA strands, where genetic codes intertwine, colored in helix blue and enzyme green


Prompt: steering wheel icon, simple colors, shades of green and dark ocean blue, sketch, futuristic, interface, schematic representation, no background


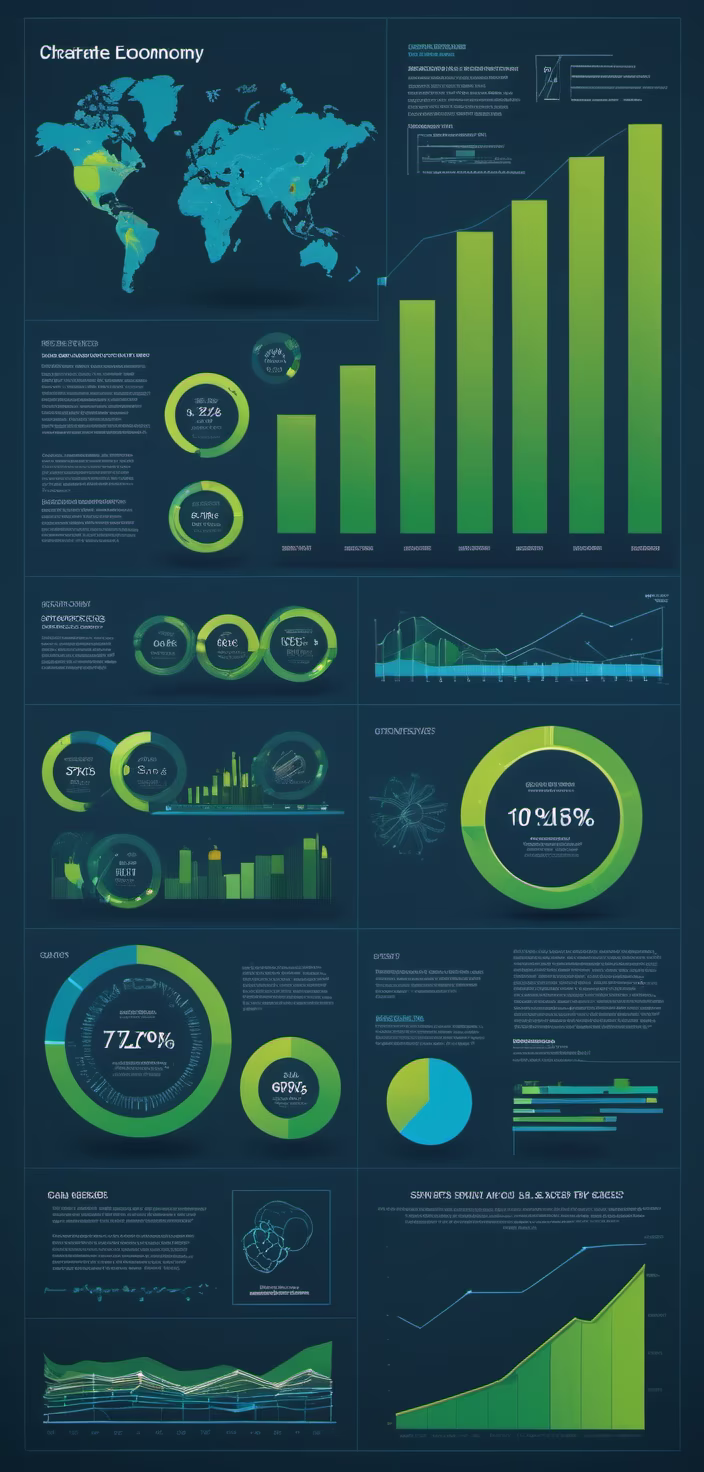
Prompt: create a visualization infographic to show opportunities and challenges of a low-carbon economy, data visualization, charts, graphs, high contrast, blue and green, white background


Prompt: Abstract lines, like electrical circuits, are placed on a clean white background. Elegant, luminous shades of blue and green create a technological atmosphere, while minimalist images of resistors and molecules introduce a scientific accent. Light reflections on the background add dynamism, emphasizing the bright essence of electrical engineering.

Prompt: For this option, I've taken a more abstract approach to the logo design. The logo features a series of overlapping shapes and lines in bold shades of blue and green, forming a stylized \"M\". The shapes suggest movement and energy, while the colors convey a sense of innovation and creativity. The design is simple yet impactful, with a modern aesthetic.
Style: Line Art


Prompt: Flowchart with various icons, 3D, flowing lines between various icons, UI design, green tone,


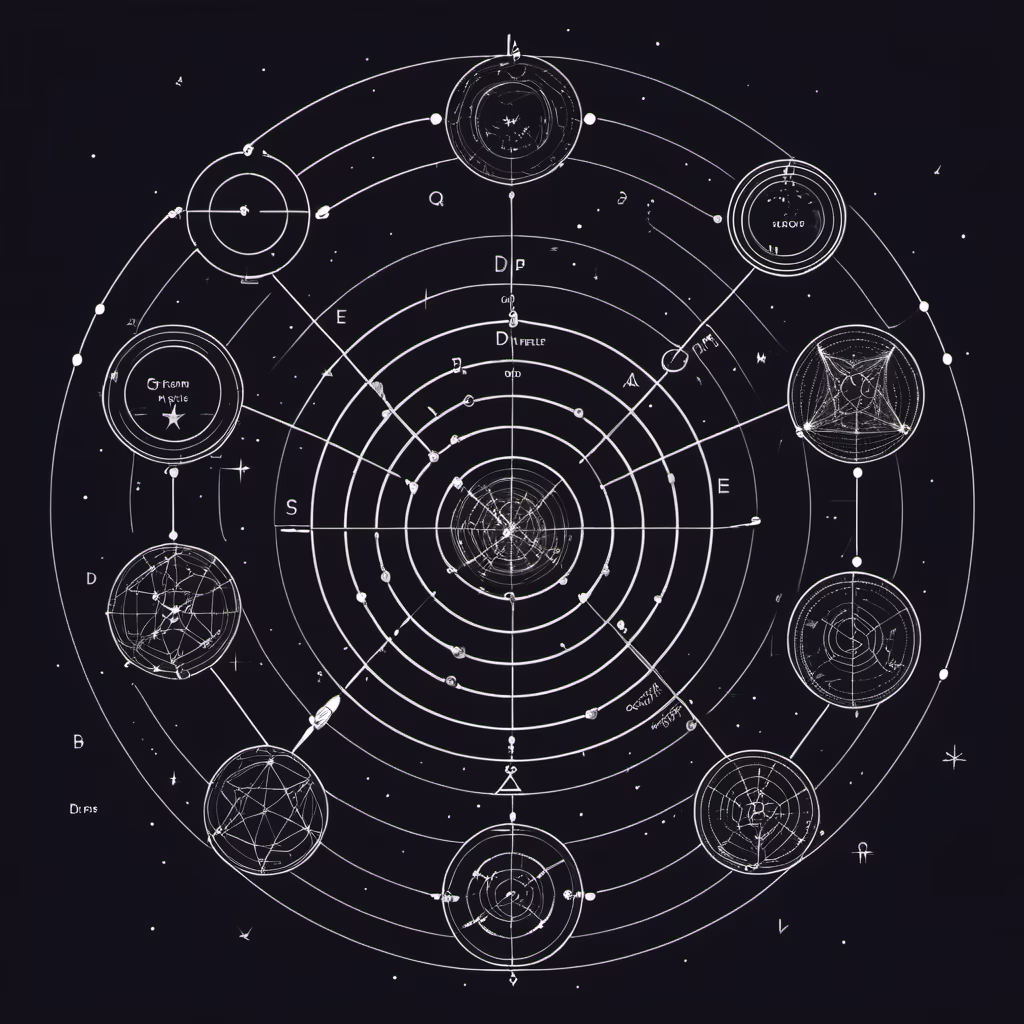
Prompt: graph that looks like a compsci tree data structure with words about dreams in its nodes , line art, astrological diagram


Prompt: an isometric icon, blue and greenfrosted glass, white acrylic material, white background, transparent technical sense, data visualization style
Prompt: a blueprint of a machine that gets a lot of peas and arranges them in groups of three to be inserted into a pea pod, technical diagram


Prompt: icon showing that driving is allowed, schematic representation , green, sketch, simple geometry


Prompt: graph that looks like a compsci data structure with words about dreams in its nodes , line art, astrological diagram


Prompt: graph that looks like a compsci data structure with words about dreams in its nodes , line art, astrological diagram


Prompt: graph that looks like a compsci data structure with words about dreams in its nodes , line art, astrological diagram


Prompt: graph that looks like a compsci data structure with words about dreams in its nodes , line art, astrological diagram

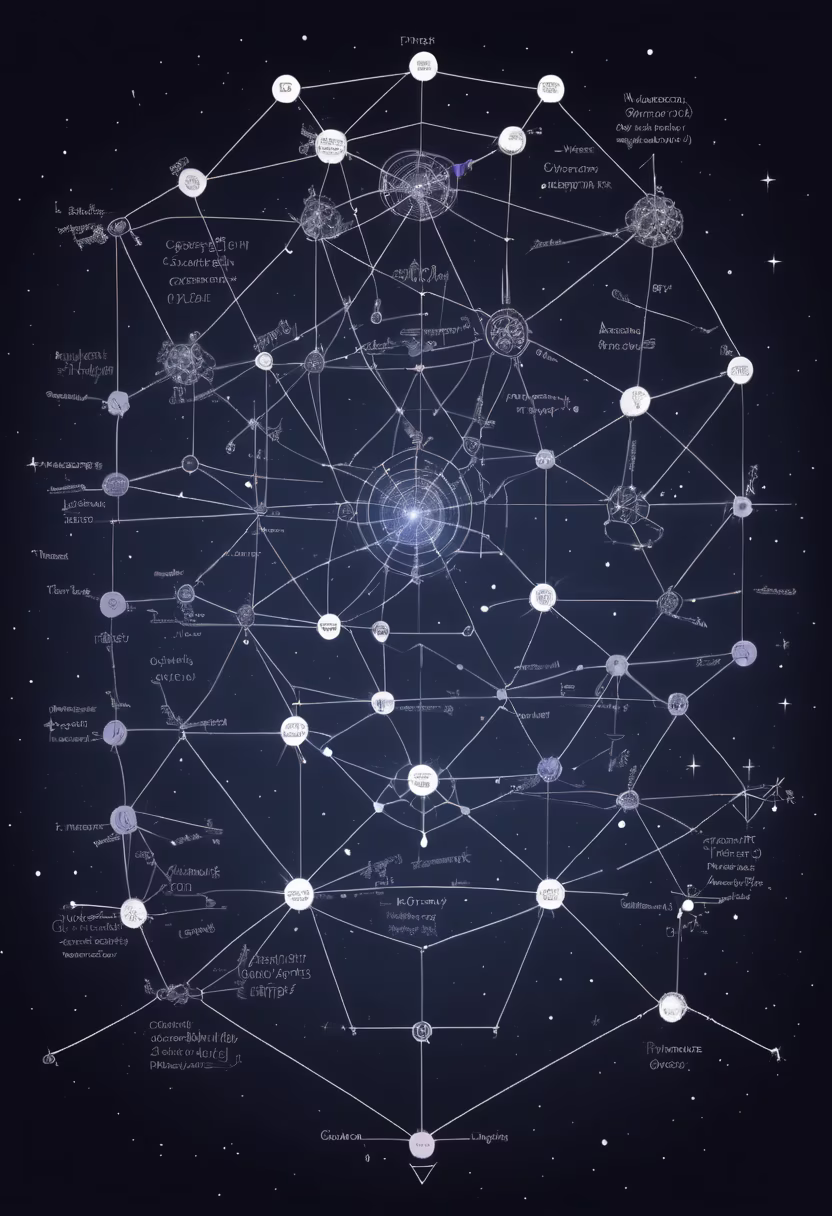
Prompt: graph that looks like a compsci data structure with words about dreams in its nodes , line art, astrological diagram


Prompt: logo of an elegant fusion of modern geometric shapes, symbolizing technological innovation, shades of blue and green, stylized VR headset hidden in the image, dynamic lines expressing exploration


Prompt: logo of an elegant fusion of modern geometric shapes, symbolizing technological innovation, shades of blue and green, stylized VR headset hidden in the image, dynamic lines expressing exploration
Prompt: Energetic luminous lines, like electrical wires, intertwine against a background in technological shades of blue and green, creating a sense of electron movement. Simple images of resistors
Style: Line Art


Prompt: For this option, I've taken a more abstract approach to the logo design. The logo features a series of overlapping shapes and lines in bright shades of blue and green, forming a stylized \"M\". The shapes suggest movement and energy, while the colors convey a sense of innovation and creativity. The design is simple yet sophisticated, with a modern aesthetic.
Style: Anime


Prompt: illustration, animation, machine learning algorithm writing itself, on a screen, receiving external input and signals


Prompt: A see-through bright green cyber wireframe of an advanced interstellar humanoid robot war machine, internal components visible


Prompt: A sleek, curved arrow, resembling the elegant flow of information, takes center stage. The arrow is comprised of interconnected, pixelated elements, symbolizing the granularity and digital nature of data. The gradient shades within the arrow indicate the dynamic movement and transformation of data through various stages. The color palette, blending vibrant blues and energetic greens, conveys a sense of growth, innovation, and vitality.
Style: Line Art


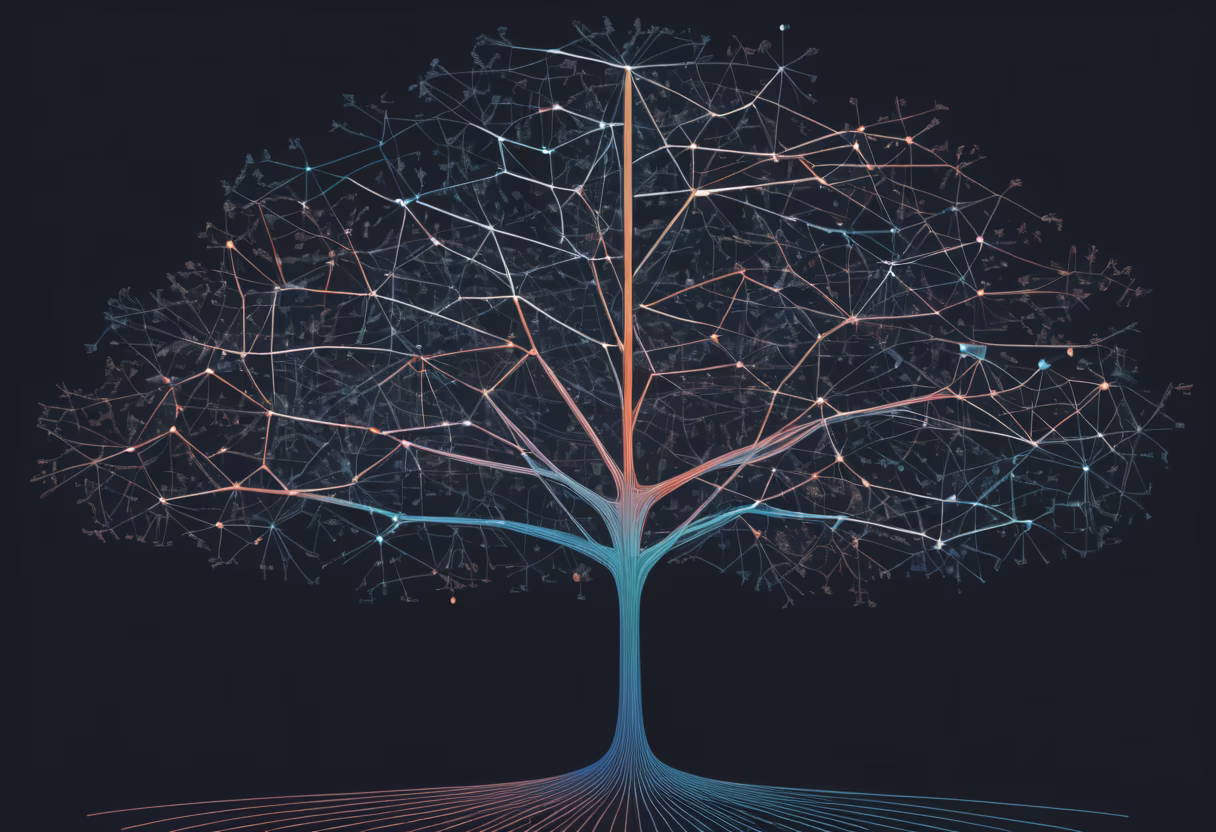
Prompt: A logo of a tree structure with leaves shaped like data nodes, symbolizing growth and information.


Prompt: Doodle style,white background, one people, desk, plants, blue and green, bold and clear outlines, simple lines, flat colors,masterpiece, rich details, 4k
Negative: mixed colours


Prompt: create a visualization infographic to show opportunities and challenges of a low-carbon economy, data visualization, charts, graphs, high contrast, blue and green, light background

Prompt: a blueprint of a machine that gets a lot of peas and arranges them in groups of three to be inserted into a pea pod


Prompt: electrical circuits. Subtle shades of blue and green add a technological edge, while images of resistors and molecules provide an educational twist, highlighting key aspects of electrical engineering. Light highlights introduce movement and highlight important elements


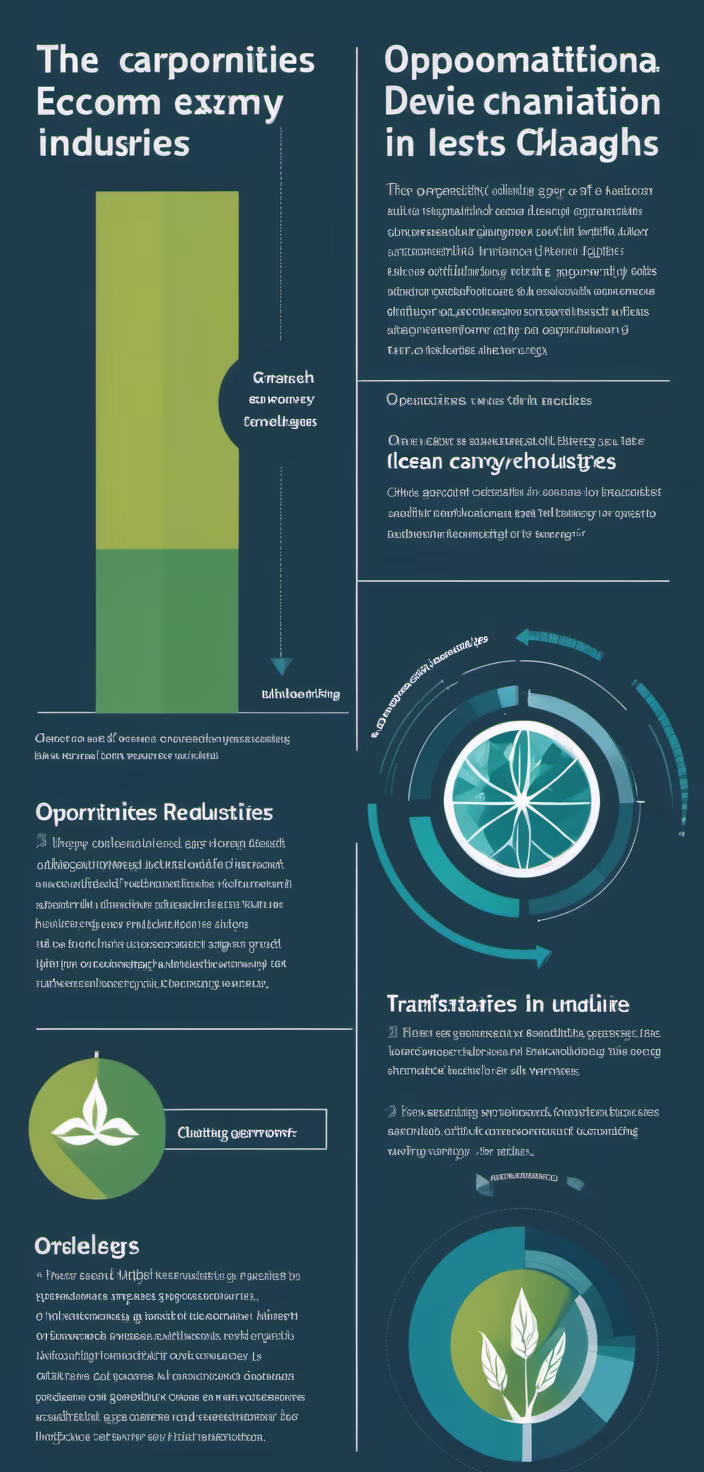
Prompt: An information graphic showing the opportunities and challenges of transitioning to a low-carbon economy. The graphic should: Have a clear title that says \"Opportunities and Challenges of the Low-Carbon Economy\" Divide the graphic into two sections - one highlighting opportunities in green, the other challenges in blue List 4-6 key opportunities such as growth of renewable energy industries, energy efficiency savings, new green jobs, etc. List 4-6 key challenges such as transition costs for high-carbon industries, developing low-carbon technologies, shifting energy infrastructure, changing consumer behavior, etc. Represent data points like projected renewable energy growth and greenhouse gas emission reductions using charts like bar graphs Connect opportunities and challenges with arrows or lines to show their relationships Use a simple, clean design with good typography, spacing and organization to make the information easy to understand Be high quality and high resolution, suitable for print or online publication The goal is to communicate in a visual, graphic-led format the business case for transitioning to clean energy and emissions reductions by outlining both the upside potential and downside risks in a balanced, coherent way.


Prompt: Neural Network Synapse Art, intricate lines and nodes forming a tree in the style of neural synapses, in emerald green, on a black background


Prompt: a logo in green blue and gray for a data engineering company with a D and a V
Style: Digital Art


Prompt: Visualize a sleek, minimalist flowchart, its nodes and connections representing the building blocks of an emergent system. The diagram exudes simplicity, yet beneath its clean exterior lies the potential for unexpected and welcome developments. Picture a few nodes breaking away from the predetermined path, symbolizing the cool surprises that can arise when allowing for unanticipated outcomes.


Prompt: a blueprint of a machine that gets a lot of peas and arranges them in groups of three to be inserted into a pea pod, technical blueprint design


Prompt: company icon, 2.5d, isometric icon, blue and greenfrosted glass, white acrylic material, white background, transparent technical sense, data visualization style


Prompt: hand sketched icerberg, its top part is blank and bottom part forms a network analysis design


