Prompt: An information graphic showing the opportunities and challenges of transitioning to a low-carbon economy. The graphic should: Have a clear title that says \"Opportunities and Challenges of the Low-Carbon Economy\" Divide the graphic into two sections - one highlighting opportunities in green, the other challenges in blue List 4-6 key opportunities such as growth of renewable energy industries, energy efficiency savings, new green jobs, etc. List 4-6 key challenges such as transition costs for high-carbon industries, developing low-carbon technologies, shifting energy infrastructure, changing consumer behavior, etc. Represent data points like projected renewable energy growth and greenhouse gas emission reductions using charts like bar graphs Connect opportunities and challenges with arrows or lines to show their relationships Use a simple, clean design with good typography, spacing and organization to make the information easy to understand Be high quality and high resolution, suitable for print or online publication The goal is to communicate in a visual, graphic-led format the business case for transitioning to clean energy and emissions reductions by outlining both the upside potential and downside risks in a balanced, coherent way.


Prompt: An information graphic showing the opportunities and challenges of transitioning to a low-carbon economy. The graphic should have a clear title that says \"Opportunities and Challenges of the Low-Carbon Economy\" Divide the graphic into two sections - one highlighting opportunities in green, the other challenges in blue List 4-6 key opportunities such as growth of renewable energy industries, energy efficiency savings, new green jobs, etc. List 4-6 key challenges such as transition costs for high-carbon industries, developing low-carbon technologies, shifting energy infrastructure, changing consumer behavior, etc. Represent data points like projected renewable energy growth and greenhouse gas emission reductions using charts like bar graphs Connect opportunities and challenges with arrows or lines to show their relationships Use a simple, clean design with good typography, spacing and organization to make the information easy to understand Be high quality and high resolution, suitable for print or online publication


Prompt: create a visualization infographic to show opportunities and challenges of a low-carbon economy, data visualization, charts, graphs, high contrast, blue and green, white background


Prompt: create a visualization infographic to show opportunities and challenges of a low-carbon economy, data visualization, charts, graphs, high contrast, blue and green, light background

Prompt: dream prompt:create a visualization infographic to show opportunities and challenges of a low-carbon economy, data visualization, charts, graphs,pastel colors, blue and green, light background


Prompt: create a visualization infographic to show opportunities and challenges of a low-carbon economy, data visualization, charts, graphs,pastel colors, blue and green, light background


Prompt: create a visualization infographic to show opportunities and challenges of a low-carbon economy, data visualization, charts, graphs,pastel colors,high contrast, blue and green, light background


Prompt: create a visualization infographic to show opportunities and challenges of a low-carbon economy, data visualization, charts, graphs, high contrast, light background


Prompt: dream prompt:create a visualization infographic to show opportunities and challenges of a low-carbon economy, data visualization, charts, graphs,pastel colors, high contrast
Prompt: create a visualization infographic to show opportunities and challenges of a low-carbon economy, charts, graphs, icons, modern design


Prompt: dream prompt:create a visualization infographic to show opportunities and challenges of a low-carbon economy, data visualization, charts, graphs,pastel colors,modern design


Prompt: dream prompt:create a visualization infographic to show opportunities and challenges of a low-carbon economy, data visualization, charts, graphs, modern design


Prompt: dream prompt:create a visualization infographic to show opportunities and challenges of a low-carbon economy, data visualization, charts, graphs, icons,pastel colors,modern design

Prompt: create a visualization infographic to show opportunities and challenges of a low-carbon economy, data visualization, charts, graphs, icons,pastel colors,modern design


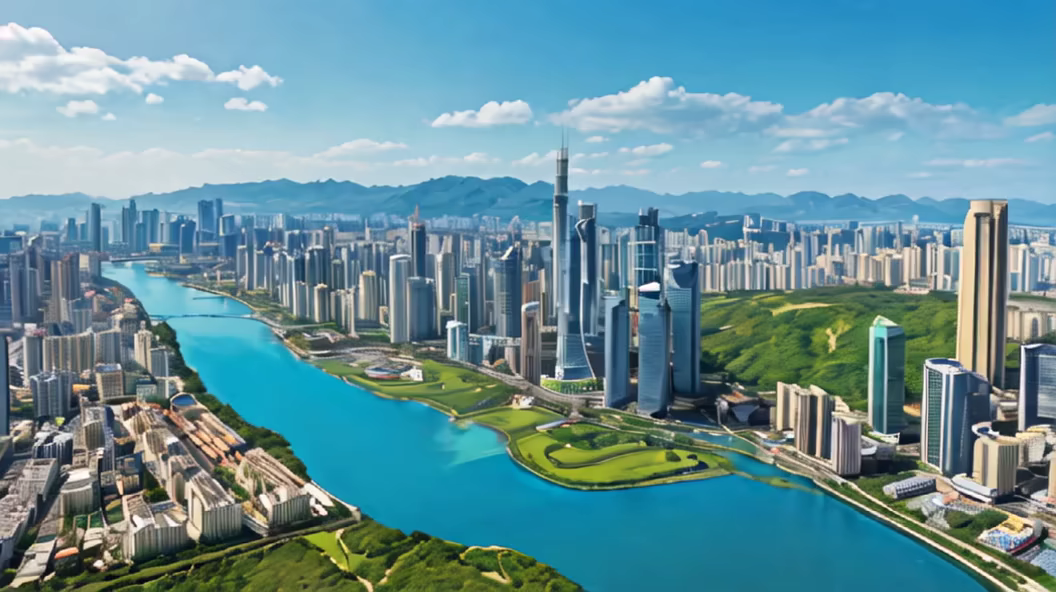
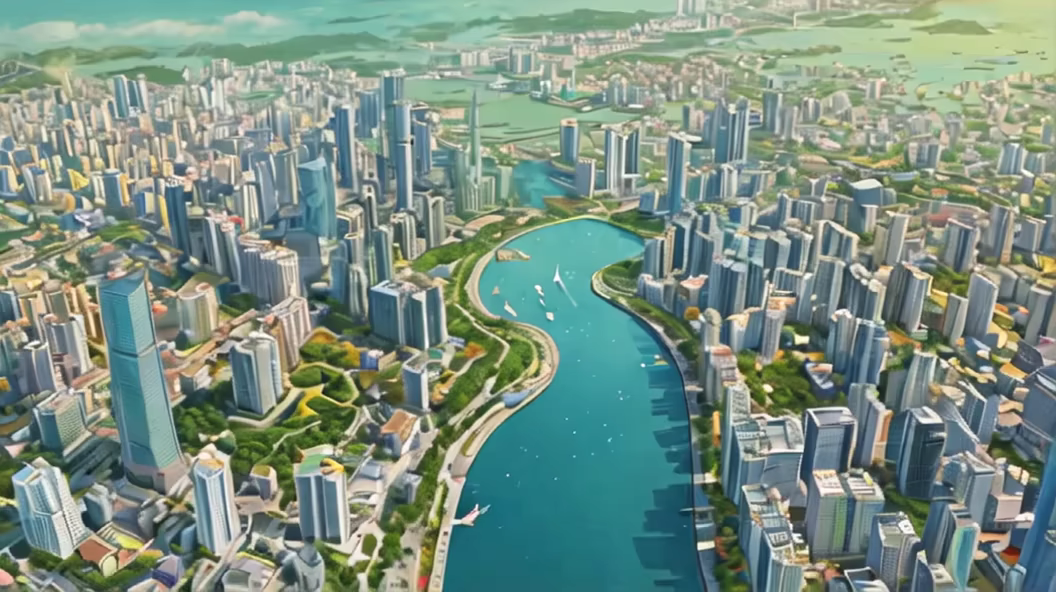
Prompt: illustration, globalization impact, global,city, light blue,green and yellow,globalization,Carbon neutrality, carbon peak, zero carbon emissions,energy conservation and emission reduction


Prompt: create a visualization infographic to show opportunities and challenges of a low-carbon economy, charts, graphs, icons, modern design, pastel colors
Style: Digital Art


Prompt: An illustration showing China's new green energy sources, including wind farms and solar arrays, with an emphasis on green and blue colours, highlighting the environmentally friendly and clean qualities, and incorporating traditional Chinese elements.


Prompt: Academic poster,globalization impact, global,city, light blue, light green and light yellow,globalization,Carbon neutrality, carbon peak, zero carbon emissions,energy conservation and emission reduction


Prompt: Create a minimalist and conceptual image that represents the abstract of a scientific study. The image should feature the Earth with a clear, healthy atmosphere on one side, and a dark, polluted atmosphere on the other side, symbolizing the impact of carbon emissions. Between the two halves of the Earth, place a large green arrow pointing upwards, representing non-carbon dioxide mitigation strategies. This arrow should be breaking through a chain made of fossil fuel molecules, symbolizing the breaking away from fossil fuel dependency. The chain should be visibly broken with pieces falling away to emphasize the concept of moving away from reliance on carbon emissions. Include small icons of renewable energy sources such as solar panels, wind turbines, and a hydrogen fuel cell around the green arrow to illustrate alternative energy solutions. Ensure the design is free of any brand names, identifiable people, and that it is simple enough to fit within a 3.33 inches by 1.875 inches space without losing clarity


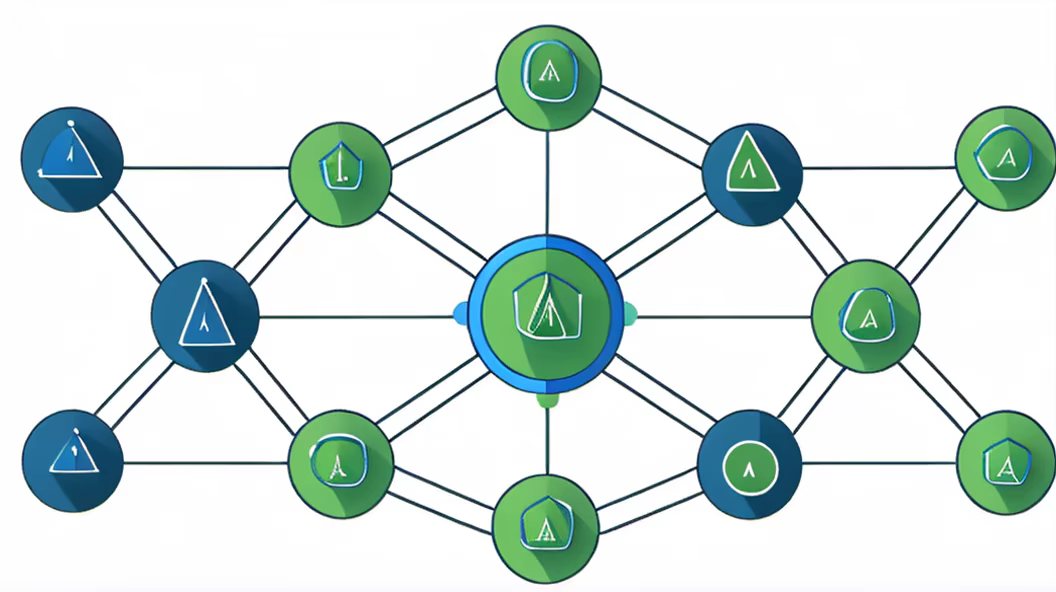
Prompt: Portray a future scenario where multiple businesses and research institutions join forces to tackle climate change through innovative renewable energy technologies such as solar, wind, and bioenergy. Emphasize the sustainability, environmental friendliness, and reduction in carbon emissions achieved by these technologies. Highlight the expertise of each organization and how they collaborate to drive research and application of new energy technologies. Describe the positive impact of this collaboration on the environment, economy, and society, as well as its crucial role in addressing global climate change challenges
Prompt: Create a minimalist and conceptual image that represents the abstract of a scientific study. The image should feature the Earth with a clear, healthy atmosphere on one side, and a dark, polluted atmosphere on the other side, symbolizing the impact of carbon emissions. Between the two halves of the Earth, place a large green arrow pointing upwards, representing non-carbon dioxide mitigation strategies. This arrow should be breaking through a chain made of fossil fuel molecules, symbolizing the breaking away from fossil fuel dependency. The chain should be visibly broken with pieces falling away to emphasize the concept of moving away from reliance on carbon emissions. Include small icons of renewable energy sources such as solar panels, wind turbines, and a hydrogen fuel cell around the green arrow to illustrate alternative energy solutions. Ensure the design is free of any brand names, identifiable people, and that it is simple enough to fit within a 3.33 inches by 1.875 inches space without losing clarity
Style: Digital Art


Prompt: A machine learning model diagram with blue and green nodes and arrows, in the style of a sketch, on a white background

Prompt: Carbon neutrality, carbon peak, zero carbon emissions,illustration, globalization impact, Macao,city, light blue,green and yellow
Prompt: Flowchart, with various icons, 3D, flowing lines between various icons, UI design, green tone, various data BI analysis, digital twin


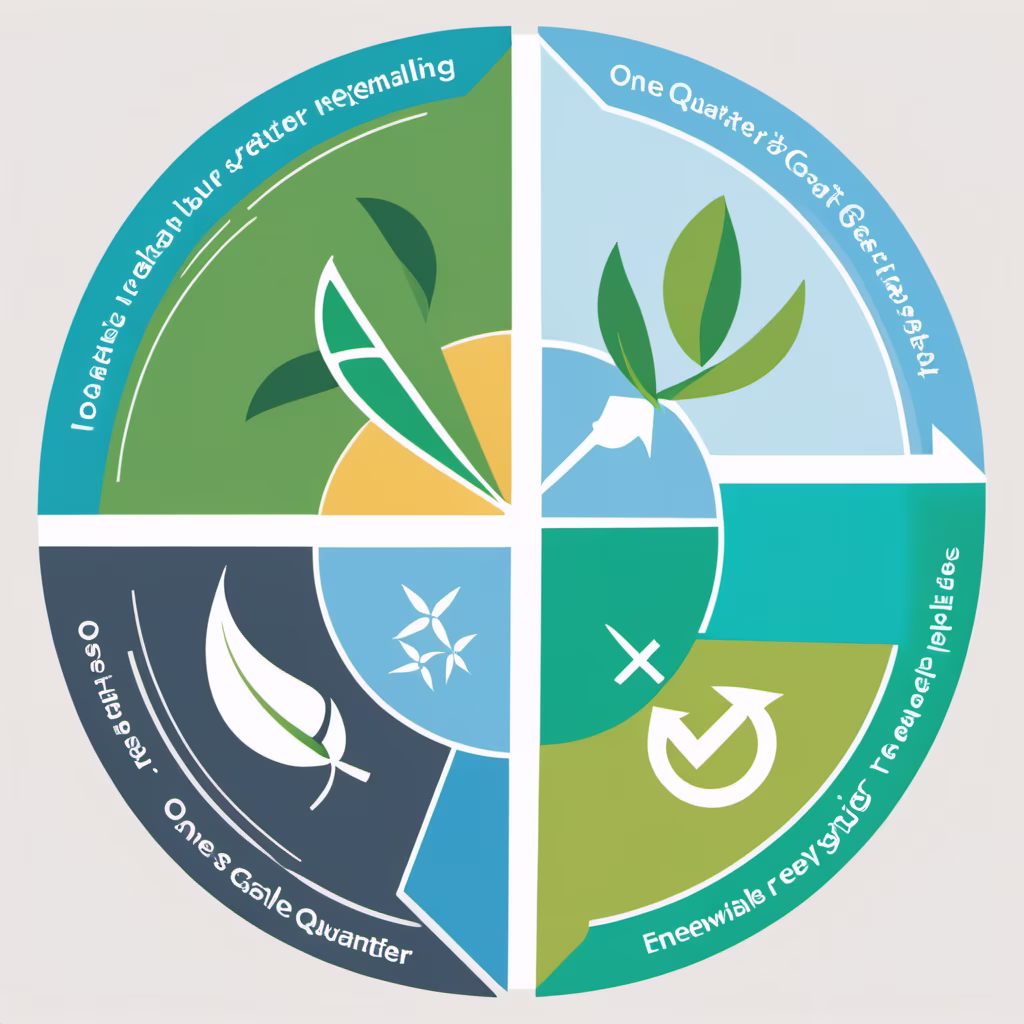
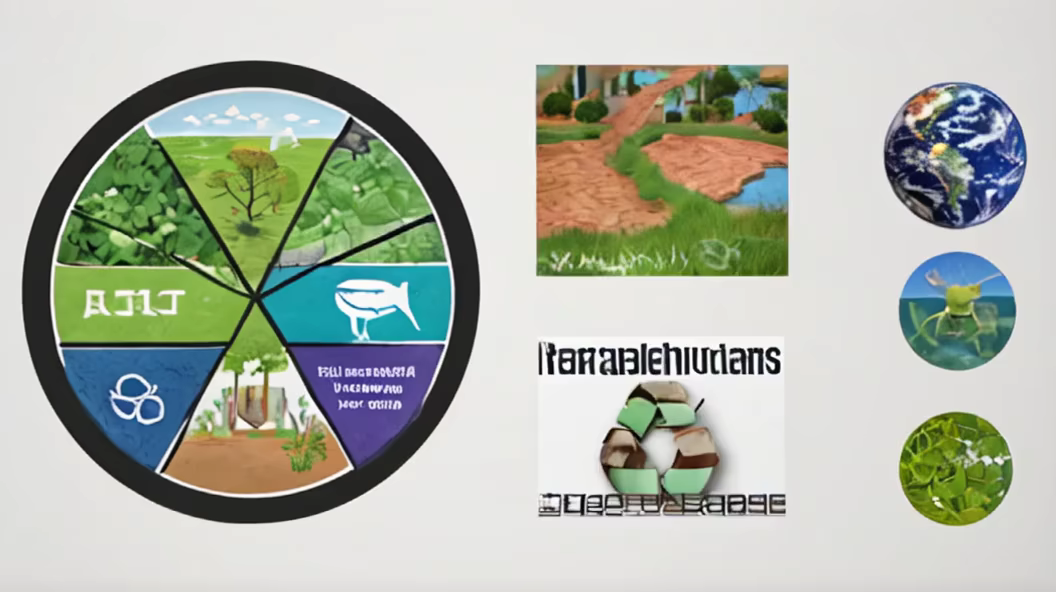
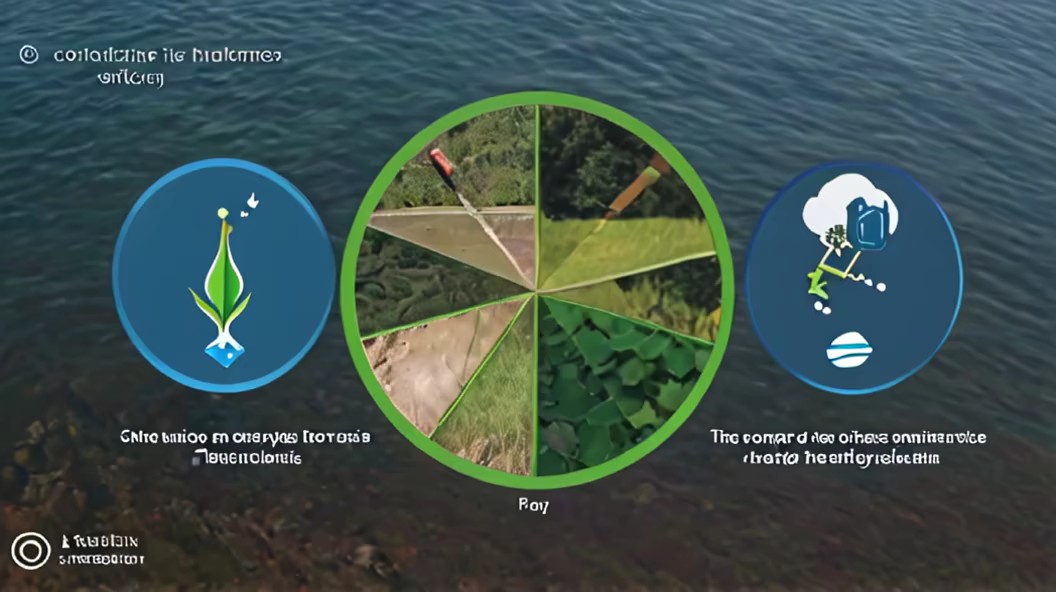
Prompt: circular competition logo divided into four quadrants: one quarter is water, one quarter is nature, one quarter is renewable electricity, one quarter is garbage and recycling


Prompt: `8-bit Pixel art, large pixels gorgeous blonde woman dancing with 2 daughters, bright lime green clothing, super low res,`Style: `Pixel Art`


Prompt: circular competition logo divided into four quadrants: one quarter is water, one quarter is nature, one quarter is renewable electricity, one quarter is garbage and recycling.


Prompt: visual representation that captures the sense of urgency and timeliness in addressing climate change. The image should emphasize the global awareness and governmental focus on sustainability, aligning perfectly with the current zeitgeist. Consider incorporating elements that convey the pressing nature of the climate crisis, the need for immediate action, and the innovative solution offered by Cold Capture Solutions, capable of removing up to 150 tons of carbon dioxide per day at an unprecedented cost efficiency of $100 per ton. Use colors, symbols, or scenes that evoke a sense of urgency and align with the contemporary global mindset towards environmental sustainability


Prompt: picture of circular competition logo divided into four quadrants: one quarter is water, one quarter is nature, one quarter is renewable electricity, one quarter is garbage


Prompt: Generate a compelling image illustrating the delicate balance between economic prosperity and environmental conservation. Imagine a scene featuring a precarious balance scale against a backdrop symbolizing the economy on one side, incorporating elements like currency notes, and the environment on the other, vividly represented by algae. The image should communicate the challenging dilemma posed by the trade-offs between economic growth and ecological sustainability. Ensure the composition is in landscape format.


Prompt: Generate a compelling image illustrating the delicate balance between economic prosperity and environmental conservation. Imagine a scene featuring a precarious balance scale against a backdrop symbolizing the economy on one side, incorporating elements like currency notes, and the environment on the other, vividly represented by algae. The image should communicate the challenging dilemma posed by the trade-offs between economic growth and ecological sustainability. Ensure the composition is in landscape format.


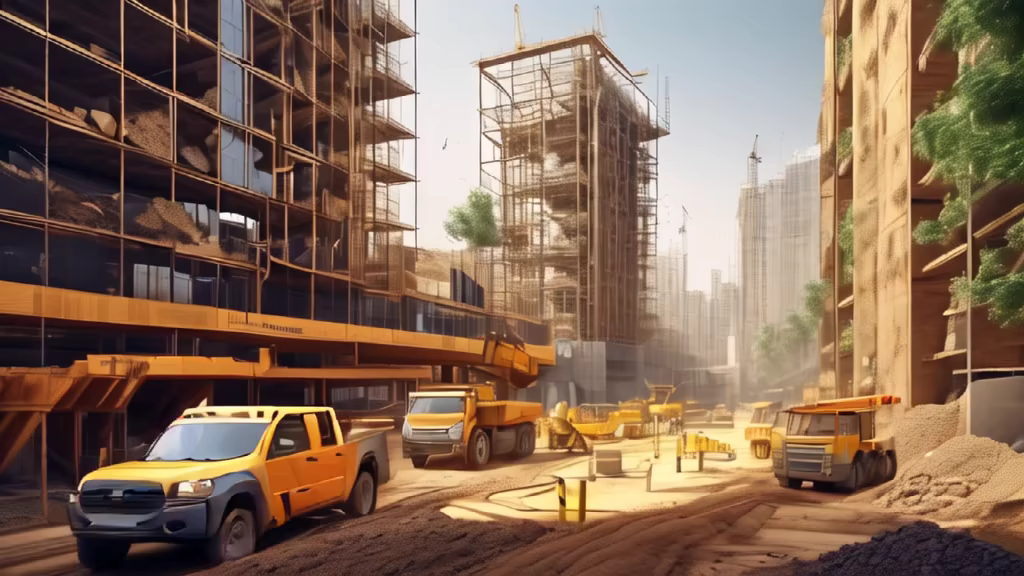
Prompt: Illustration of a Dynamic intelligent systems of systems Making Construction Sites Efficient, Sustainable and Green

Prompt: dream prompt:create a visualization infographic to show opportunities and challenges of a low-carbon economy, data visualization, charts, graphs,pastel colors, blue and green, light background
Style: 3D Model


Prompt: Girl (thirty years old) walks along the beach walking (smiling) towards the camera, blue bikini (full body), (oval face, cute, short brown hair, wears blue cat glasses (realistic skin texture, detailed drawing of eyes, mouth and nose, medium breasts, legs details, super realistic, (an octopus tattooed on the stomach) 8k, detailed detail, high resolution, RAW, nikon d850 style shooting, aspect: 16:9


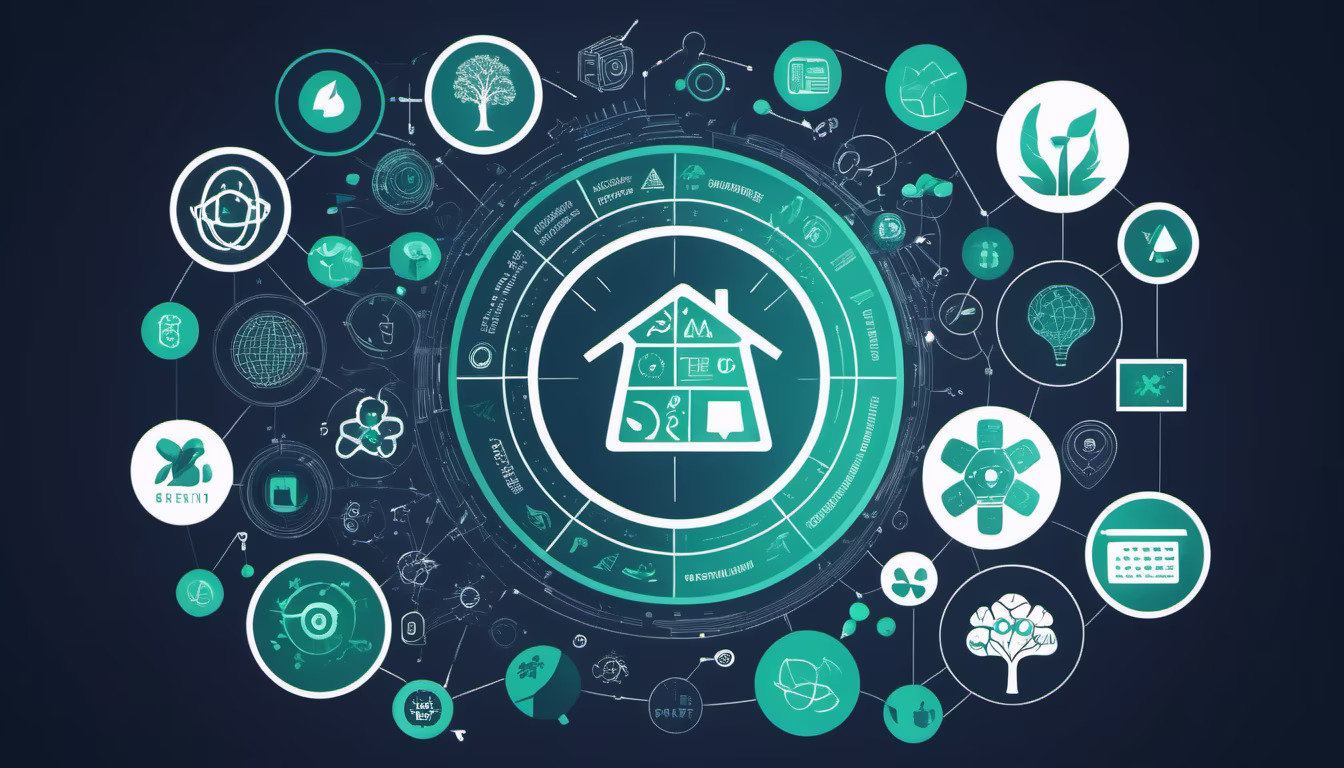
Prompt: Generate a promotional poster for the \"Digital Ecology Partner Conference\", use modern and technological images to highlight the theme of digital ecology, use modern icons and digital elements, and introduce technological elements, such as AI patterns, digital lines, data analysis and other backgrounds pattern, emphasizing the theme of digital ecology.

Prompt: I want a circular competition logo divided into four quadrants: the water section, the nature section, the renewable electricity section, the garbage and recycling section
Prompt: a robot with a cup of coffee in one hand and an ice cream cone in the other hand reflective shiny polished robot made of gold with grow lights led lighting high tech equipment , cinematic, 24 fps
Negative: low quality, cartoon, anime,3D rendering


Prompt: A sleek, curved arrow, resembling the elegant flow of information, takes center stage. The arrow is comprised of interconnected, pixelated elements, symbolizing the granularity and digital nature of data. The gradient shades within the arrow indicate the dynamic movement and transformation of data through various stages. The color palette, blending vibrant blues and energetic greens, conveys a sense of growth, innovation, and vitality.
Style: Line Art


Prompt: circular competition logo divided into four sections: the water section, the nature section with some palm trees, the renewable electricity section, the garbage and recycling section.


Prompt: Generate an image showcasing the dynamic talent acquisition cycle in the oil and gas industry. Visualize the stages, from workforce planning and job role definition to recruitment strategy and candidate onboarding. Feature diverse professionals engaged in technical interviews, negotiations, and onboarding sessions. Highlight the integration of cutting-edge technology and industry-specific tools. Capture the essence of a vibrant and evolving talent ecosystem within the oil and gas sector, emphasizing the importance of skilled professionals in driving success and innovation


Prompt: Ethereal Mechanics' depiction of DNA strands, where genetic codes intertwine, colored in helix blue and enzyme green


Prompt: Generate a promotional poster for the \"Digital Ecology Partner Conference\", use modern and technological images to highlight the theme of digital ecology, use modern icons and digital elements, introduce technological elements, and emphasize the theme of digital ecology.


Prompt: electrical circuits. Subtle shades of blue and green add a technological edge, while images of resistors and molecules provide an educational twist, highlighting key aspects of electrical engineering. Light highlights introduce movement and highlight important elements


Prompt: an infographic like illustration about code migration. It should show a clear distincition between messy code and clear code, without going in to too much detail. There should between the two representations of code. For clarity, put a box around the illustration of the \"messy code\" and a box around the \"clean code\" and put an arrow between them to show we are moving from bad to good


Prompt: circular competition logo divided into four quadrants: the water section, the nature section with some Arabian palm trees, the renewable electricity section, the garbage and recycling section.
Prompt: Graphic displaying financial data analysis with AI, AI-powered banking or fintech apps, or professionals working in the finance sector with AI technologies.