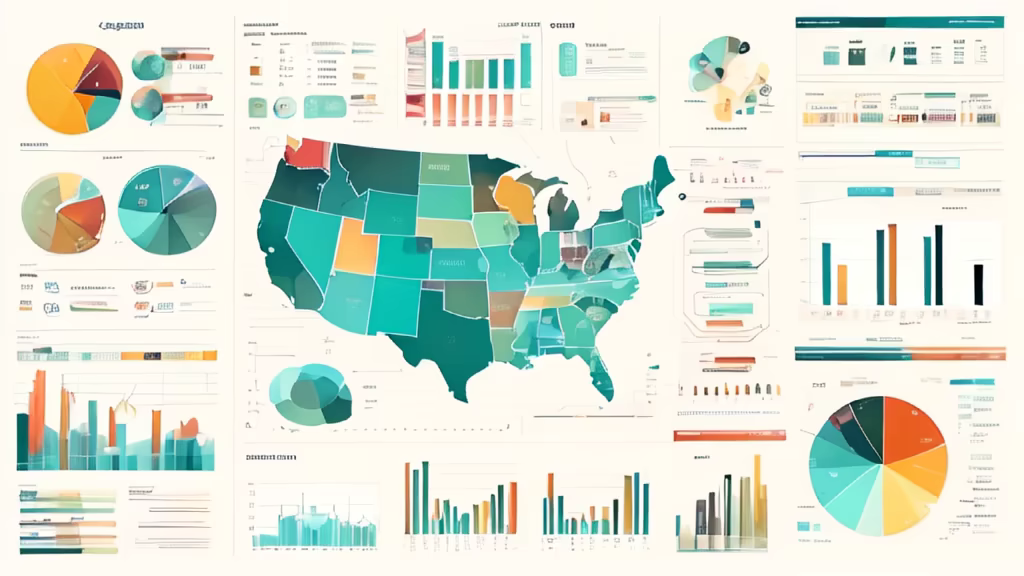
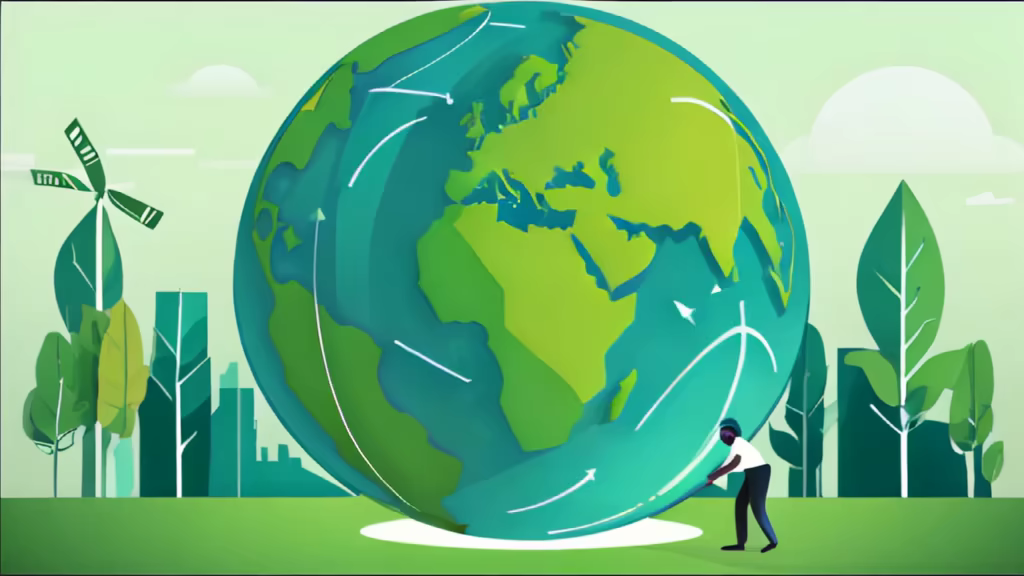
Prompt: create a visualization infographic to show opportunities and challenges of a low-carbon economy, data visualization, charts, graphs, icons,pastel colors,modern design


Prompt: create a visualization infographic to show opportunities and challenges of a low-carbon economy, charts, graphs, icons, modern design


Prompt: dream prompt:create a visualization infographic to show opportunities and challenges of a low-carbon economy, data visualization, charts, graphs, icons,pastel colors,modern design

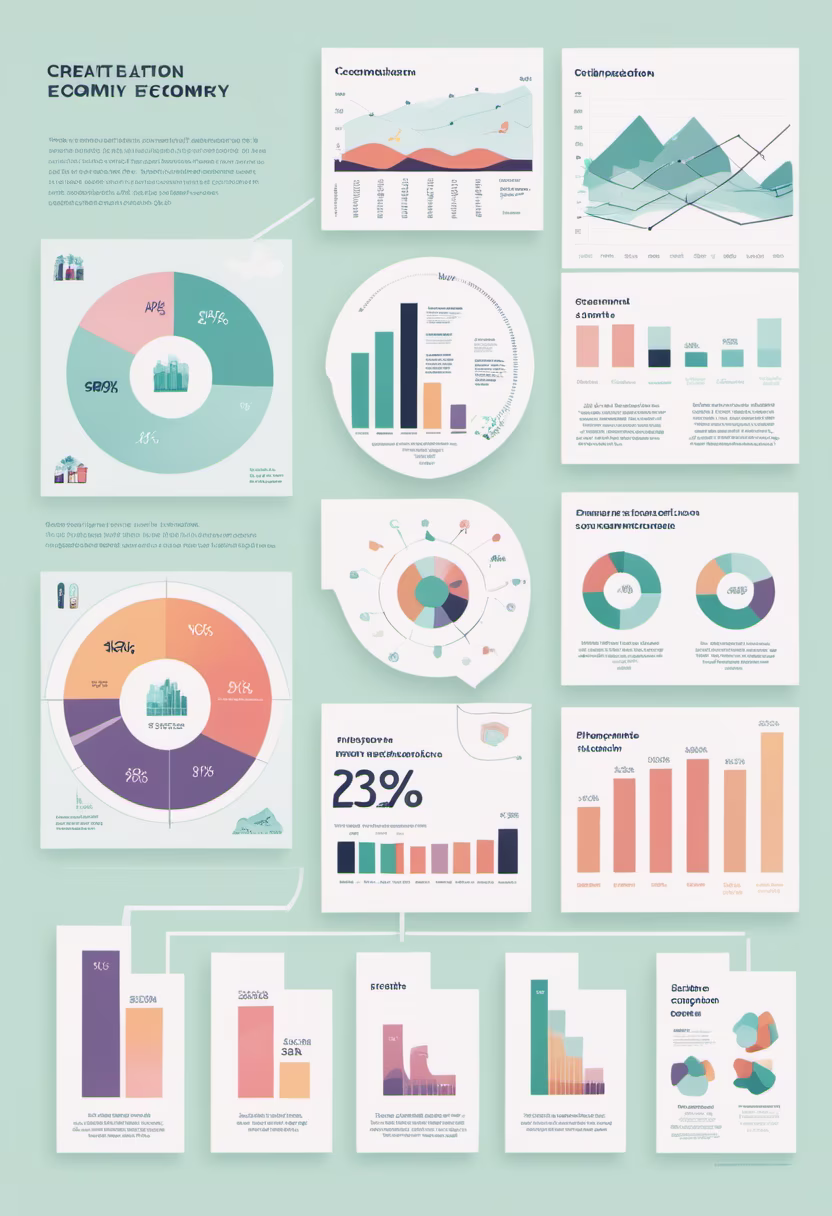
Prompt: create a visualization infographic to show opportunities and challenges of a low-carbon economy, data visualization, charts, graphs, high contrast, light background


Prompt: create a visualization infographic to show opportunities and challenges of a low-carbon economy, data visualization, charts, graphs,pastel colors,high contrast, blue and green, light background
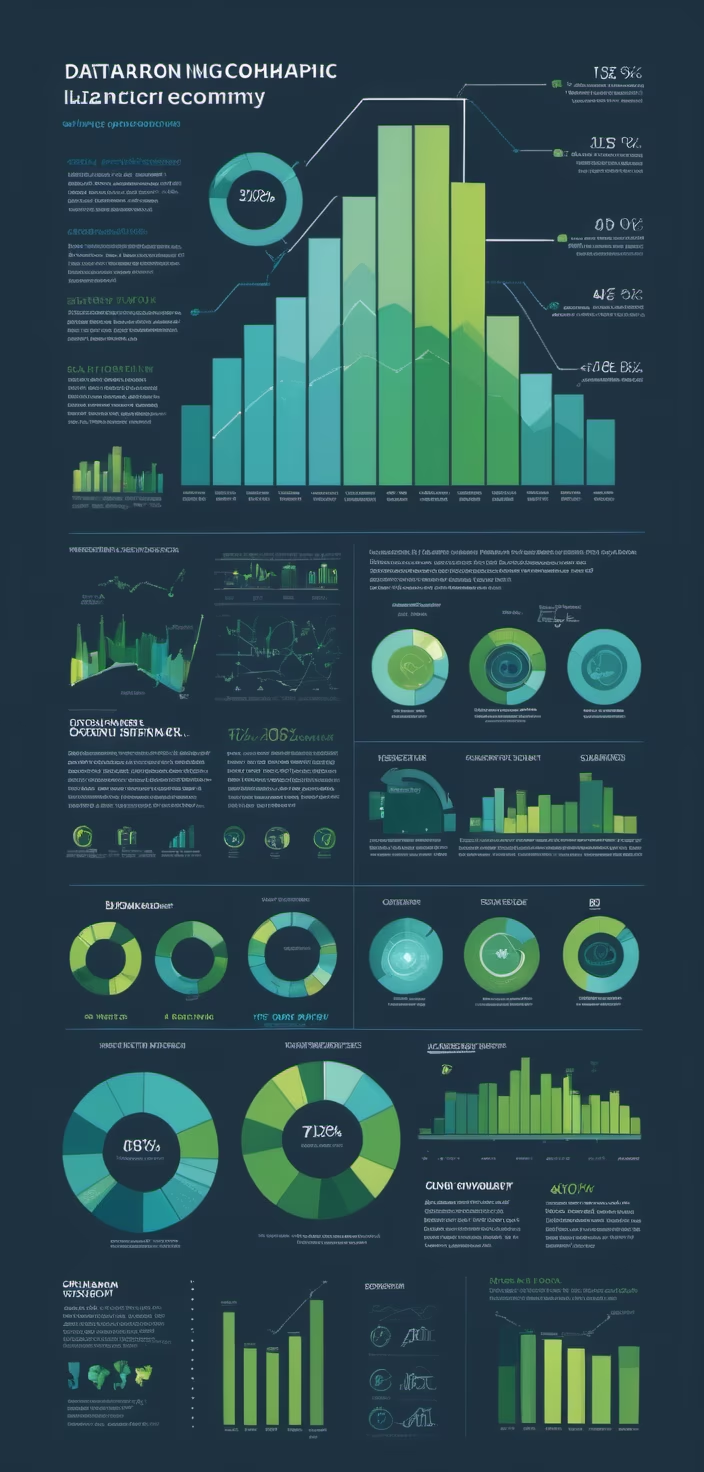

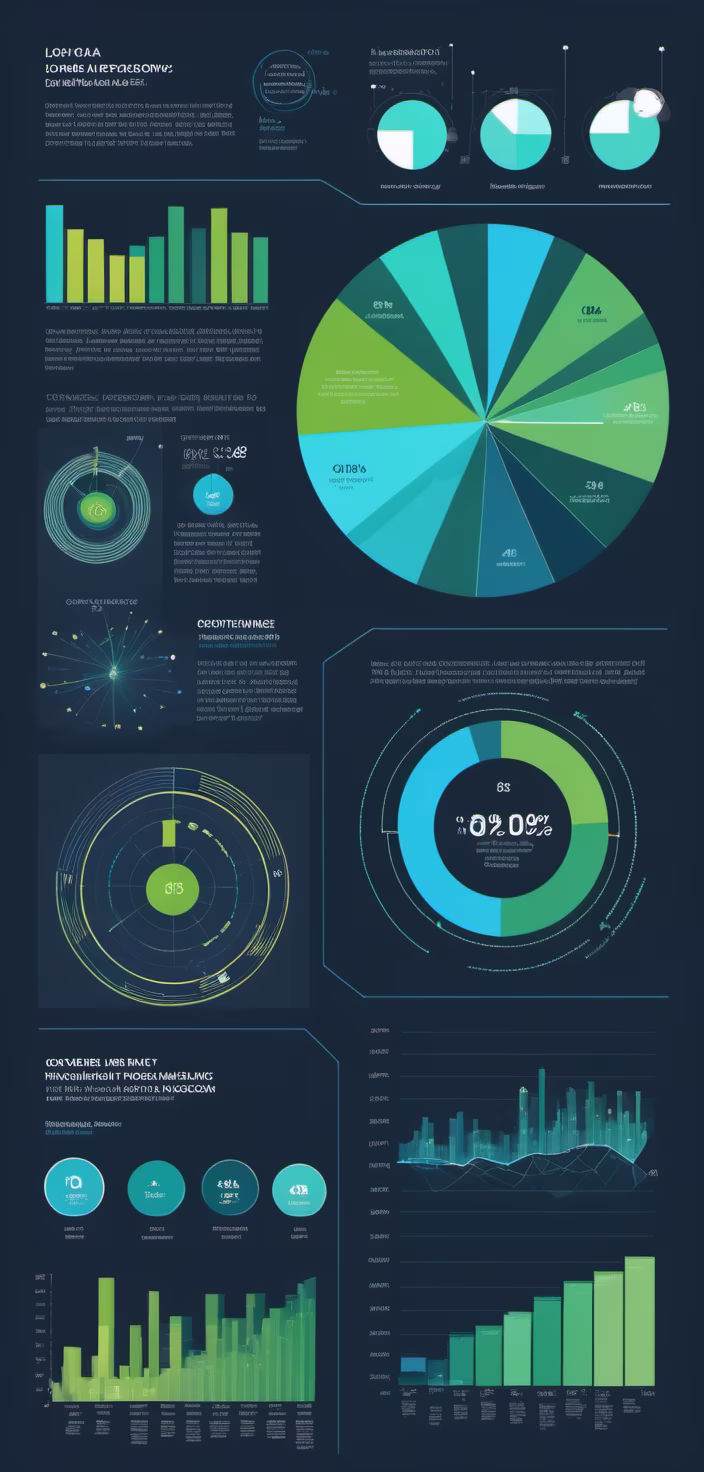

Prompt: dream prompt:create a visualization infographic to show opportunities and challenges of a low-carbon economy, data visualization, charts, graphs,pastel colors,modern design


Prompt: create a visualization infographic to show opportunities and challenges of a low-carbon economy, data visualization, charts, graphs,pastel colors, blue and green, light background


Prompt: create a visualization infographic to show opportunities and challenges of a low-carbon economy, data visualization, charts, graphs, high contrast, blue and green, light background
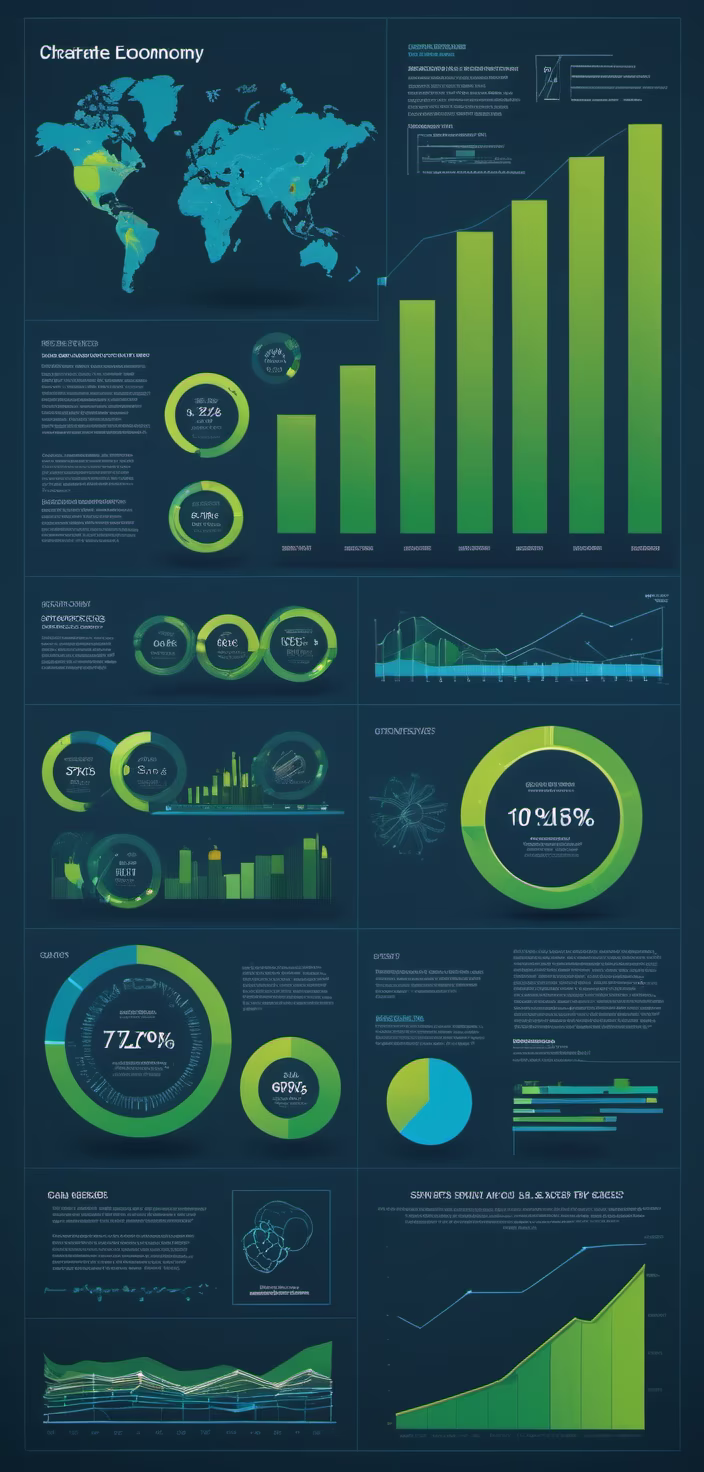

Prompt: create a visualization infographic to show opportunities and challenges of a low-carbon economy, charts, graphs, icons, modern design, pastel colors
Style: Digital Art


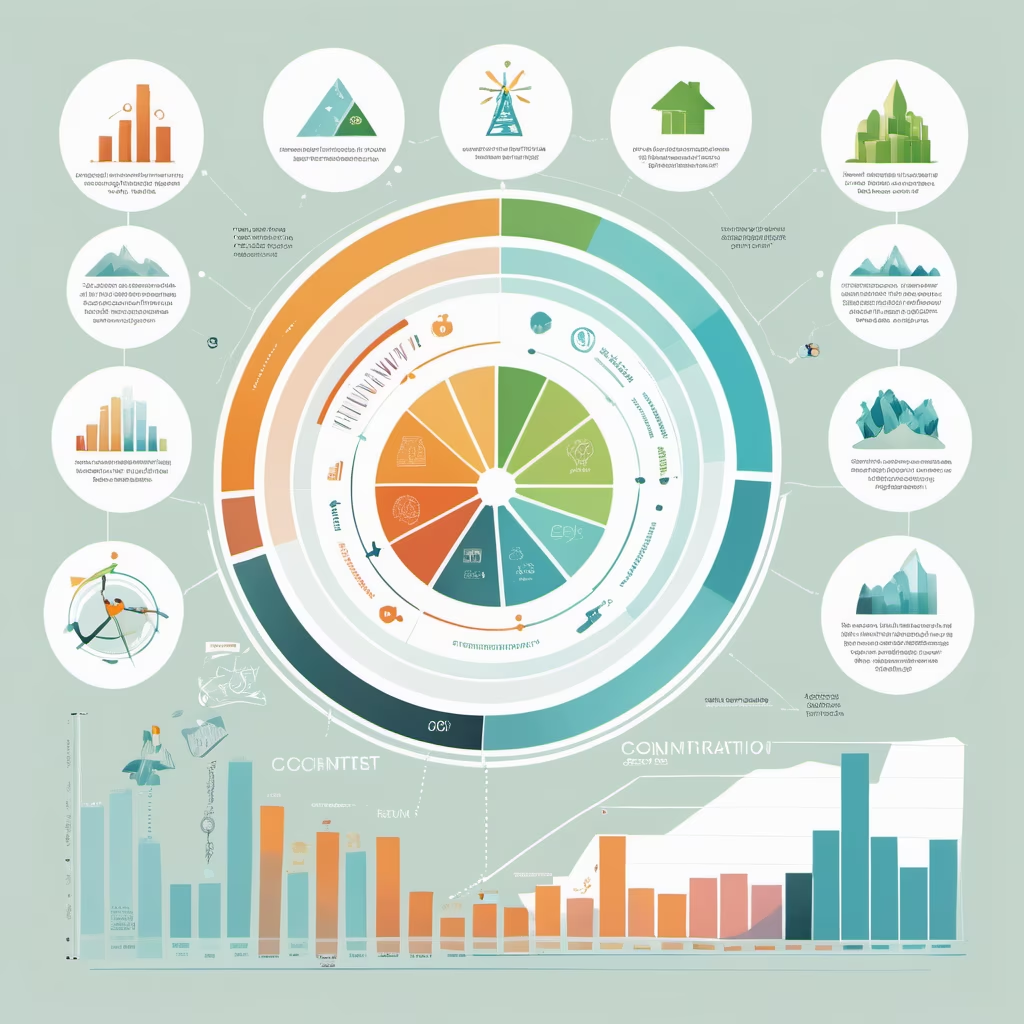
Prompt: dream prompt:create a visualization infographic to show opportunities and challenges of a low-carbon economy, data visualization, charts, graphs,pastel colors, high contrast
Prompt: create a visualization infographic to show opportunities and challenges of a low-carbon economy, data visualization, charts, graphs, high contrast, blue and green, white background


Prompt: dream prompt:create a visualization infographic to show opportunities and challenges of a low-carbon economy, data visualization, charts, graphs, modern design


Prompt: dream prompt:create a visualization infographic to show opportunities and challenges of a low-carbon economy, data visualization, charts, graphs,pastel colors, blue and green, light background

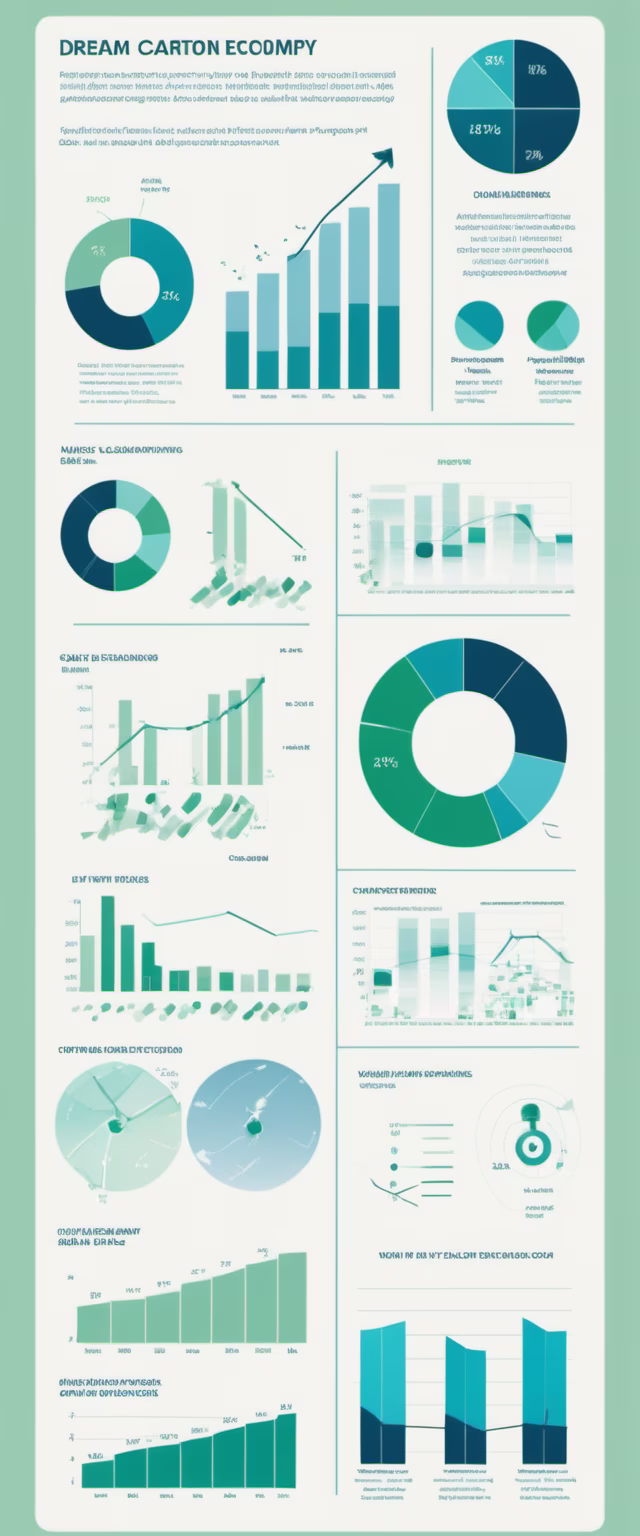


Prompt: dream prompt:create a visualization infographic to show opportunities and challenges of a low-carbon economy, data visualization, charts, graphs,pastel colors, blue and green, light background
Style: 3D Model


Prompt: `8-bit Pixel art, large pixels gorgeous blonde woman dancing with 2 daughters, bright lime green clothing, super low res,`Style: `Pixel Art`


Prompt: create a simple, colorful data visualization graphic to visualize two data points: (1) 100+ building facilities (2) 10 million+ sq ft of building space.


Prompt: Create a modern, dynamic illustration for a news article, themed '[Insert Article Theme Here]'. The graphic design should visually interpret the core concept of the article, using elements and symbols that capture its essence. reflect the forward-looking nature of the topic. The artwork should be engaging and suitable for a digital news platform, capturing the attention of viewers and complementing the article's subject matter
Negative: text, word, letters


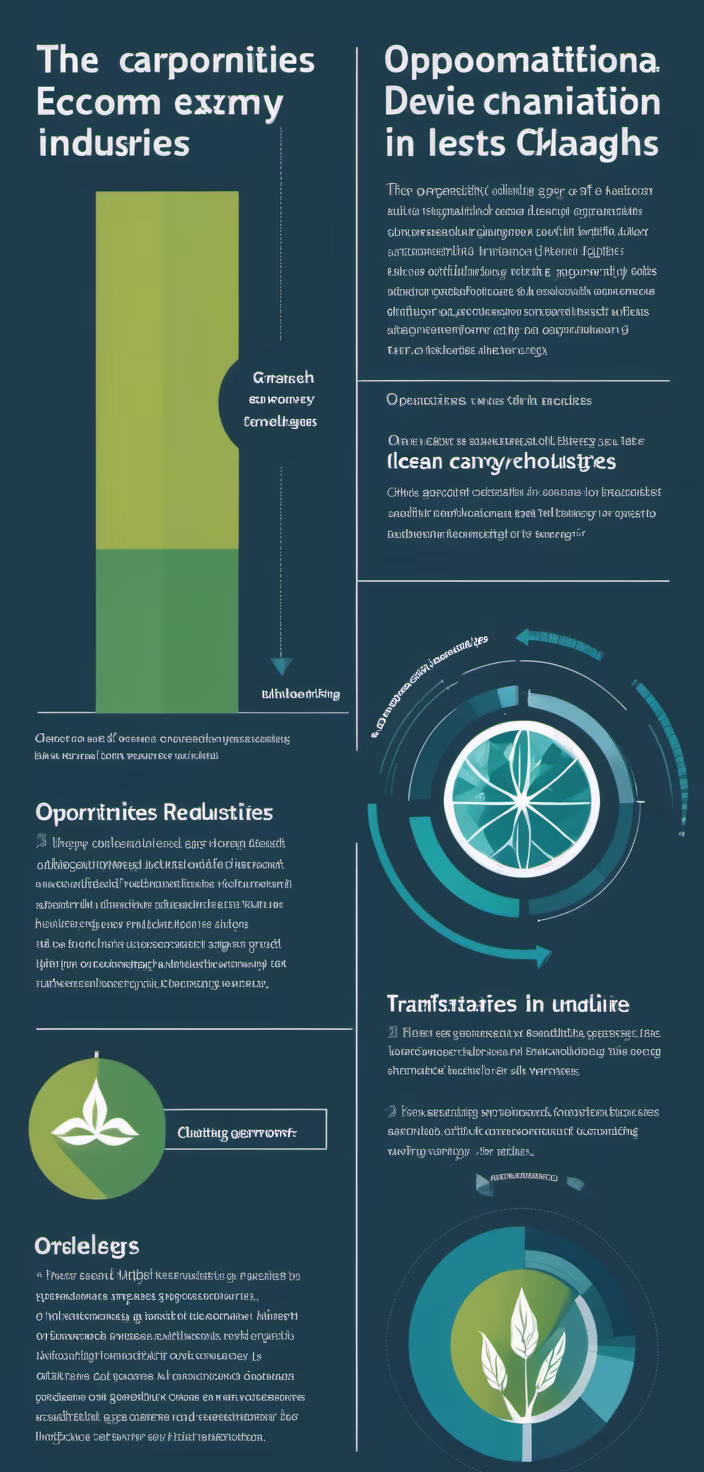
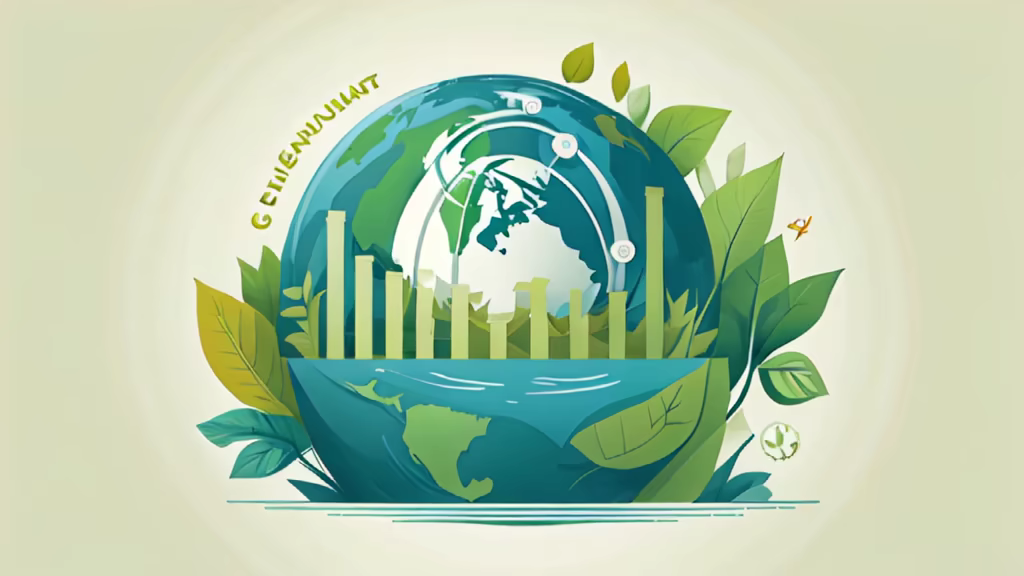
Prompt: An information graphic showing the opportunities and challenges of transitioning to a low-carbon economy. The graphic should have a clear title that says \"Opportunities and Challenges of the Low-Carbon Economy\" Divide the graphic into two sections - one highlighting opportunities in green, the other challenges in blue List 4-6 key opportunities such as growth of renewable energy industries, energy efficiency savings, new green jobs, etc. List 4-6 key challenges such as transition costs for high-carbon industries, developing low-carbon technologies, shifting energy infrastructure, changing consumer behavior, etc. Represent data points like projected renewable energy growth and greenhouse gas emission reductions using charts like bar graphs Connect opportunities and challenges with arrows or lines to show their relationships Use a simple, clean design with good typography, spacing and organization to make the information easy to understand Be high quality and high resolution, suitable for print or online publication


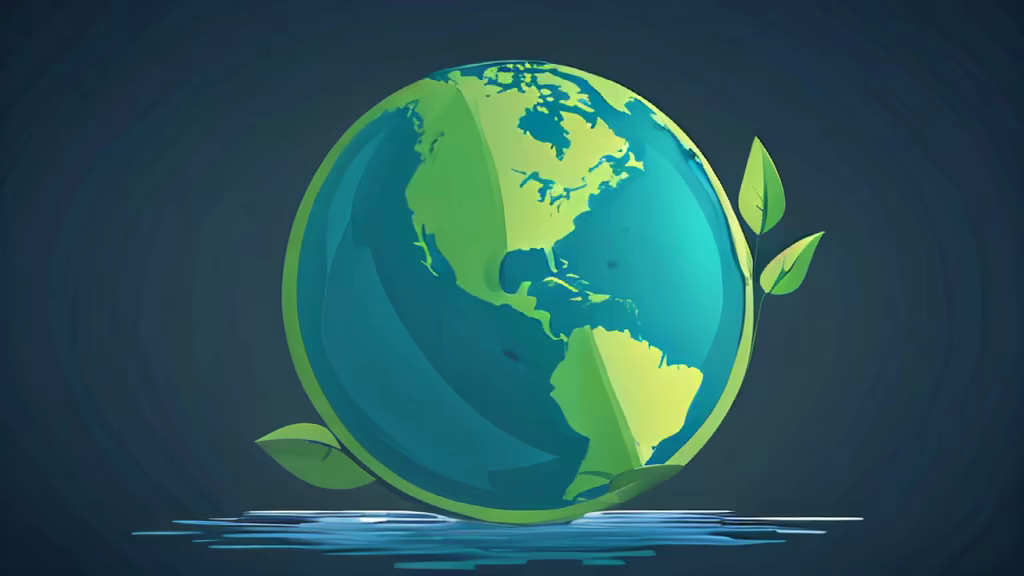
Prompt: Academic poster,globalization impact, global,city, light blue, light green and light yellow,globalization,Carbon neutrality, carbon peak, zero carbon emissions,energy conservation and emission reduction


Prompt: An information graphic showing the opportunities and challenges of transitioning to a low-carbon economy. The graphic should: Have a clear title that says \"Opportunities and Challenges of the Low-Carbon Economy\" Divide the graphic into two sections - one highlighting opportunities in green, the other challenges in blue List 4-6 key opportunities such as growth of renewable energy industries, energy efficiency savings, new green jobs, etc. List 4-6 key challenges such as transition costs for high-carbon industries, developing low-carbon technologies, shifting energy infrastructure, changing consumer behavior, etc. Represent data points like projected renewable energy growth and greenhouse gas emission reductions using charts like bar graphs Connect opportunities and challenges with arrows or lines to show their relationships Use a simple, clean design with good typography, spacing and organization to make the information easy to understand Be high quality and high resolution, suitable for print or online publication The goal is to communicate in a visual, graphic-led format the business case for transitioning to clean energy and emissions reductions by outlining both the upside potential and downside risks in a balanced, coherent way.


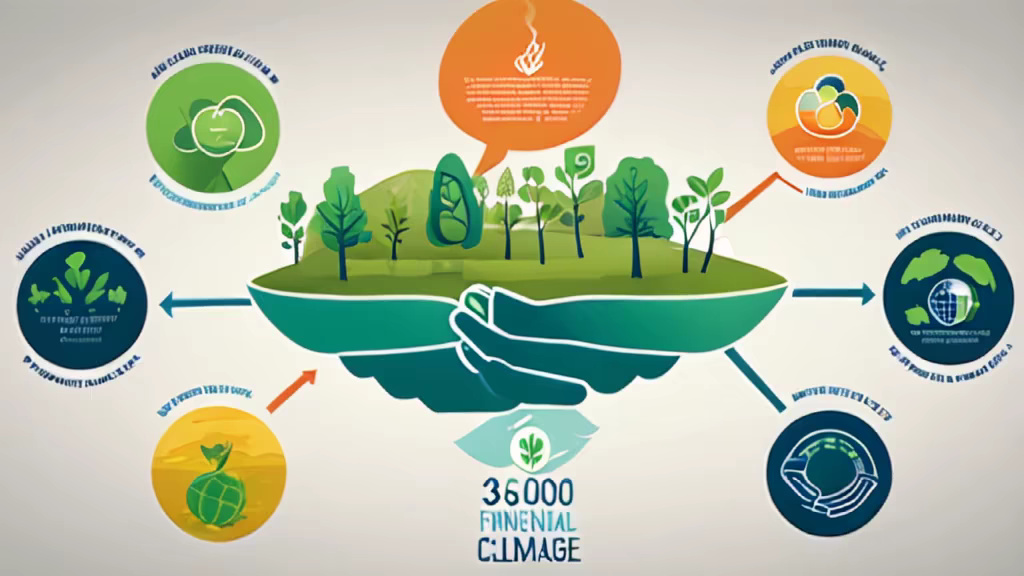
Prompt: Create a short, professional video with animated graphics illustrating the flow of funds into environmentally sustainable projects. Emphasize the global impact of climate finance and the positive changes it can bring. Use a concise and compelling voiceover to explain the importance of financial support in combating climate change.
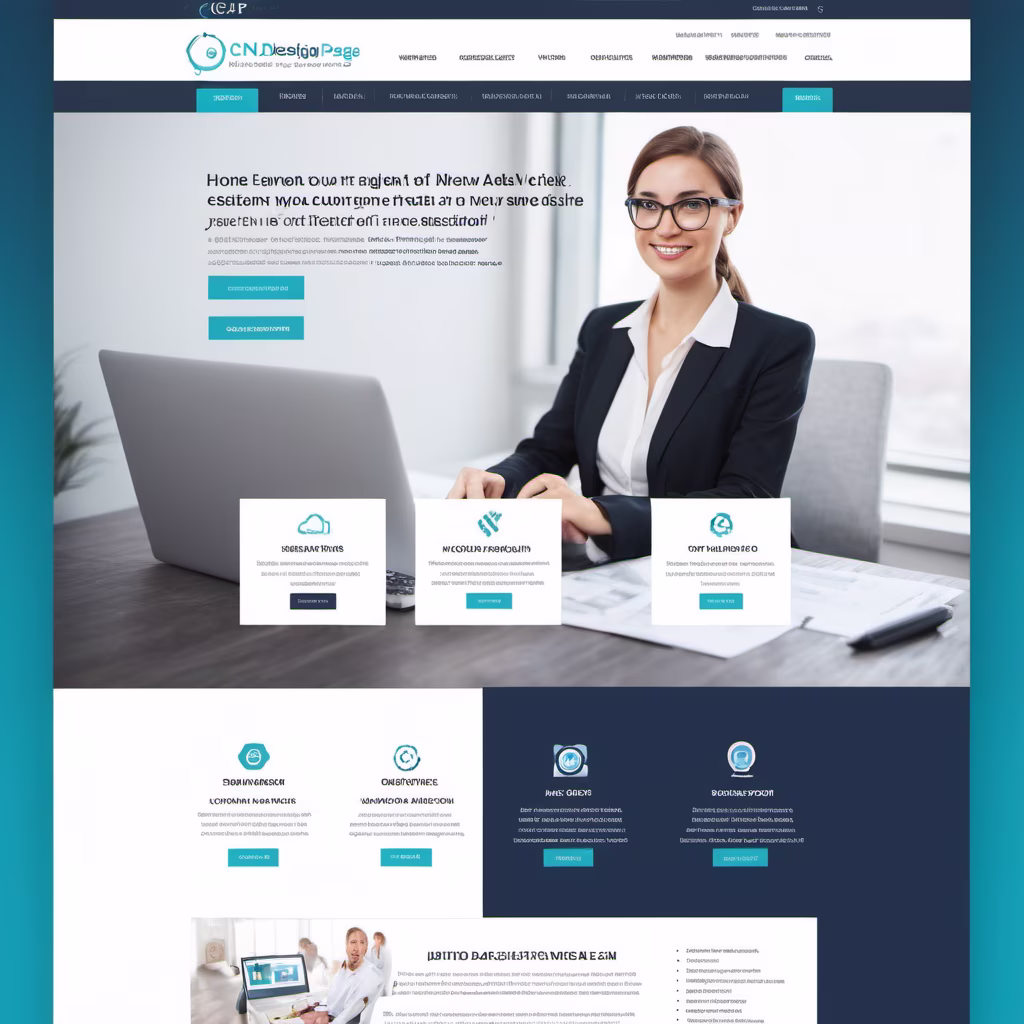
Prompt: create a web design for the home page of a website that offers company data consultation by CNPJ informed, we want a modern and elegant design, hd resolution, style: photographic

Prompt: This visual tool effectively communicates the importance of understanding the source and origin of advancements, encouraging a comprehensive comprehension of the journey leading to the final technological outcome.


Prompt: Generate a promotional poster image, with blue as the main color, and some illusory backgrounds with a modern and technological feel. The transparency is below 30%, flattened, highlighting the theme of data intelligence, without small icon elements, and introducing digital technological elements. , emphasizing the theme of digital ecology, not having concrete physical icons, 8k high definition.


Prompt: Generate a promotional poster image, with blue as the main color, and some illusory backgrounds with a modern and technological feel. The transparency is below 30%, flattened, highlighting the theme of data intelligence, without small icon elements, and introducing digital technological elements. , emphasizing the theme of digital ecology, not having concrete physical icons, 8k high definition.


Prompt: Flowchart, with various icons, 3D, flowing lines between various icons, UI design, green tone, various data BI analysis, digital twin


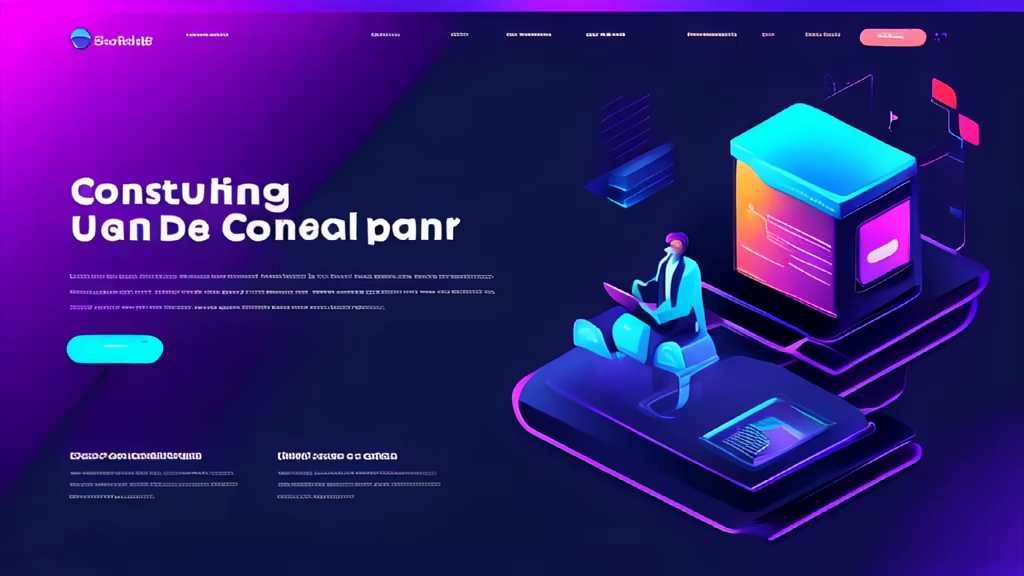
Prompt: Create a modern and clean UI design for an IT consulting website with a light color scheme. The design should include a hero section with a real photo as the background image, such as a modern office setting or a technology-related im The next section of hero section should include text that highlights the key services offered by the IT consulting firm. The text should be concise, informative, and engaging, providing visitors with a clear understanding of the firm's expertise and offerings. Use a modern and professional font that is easy to read, and ensure that the text complements the overall design aesthetic. Consider incorporating subtle animation effects to draw attention to the important information.

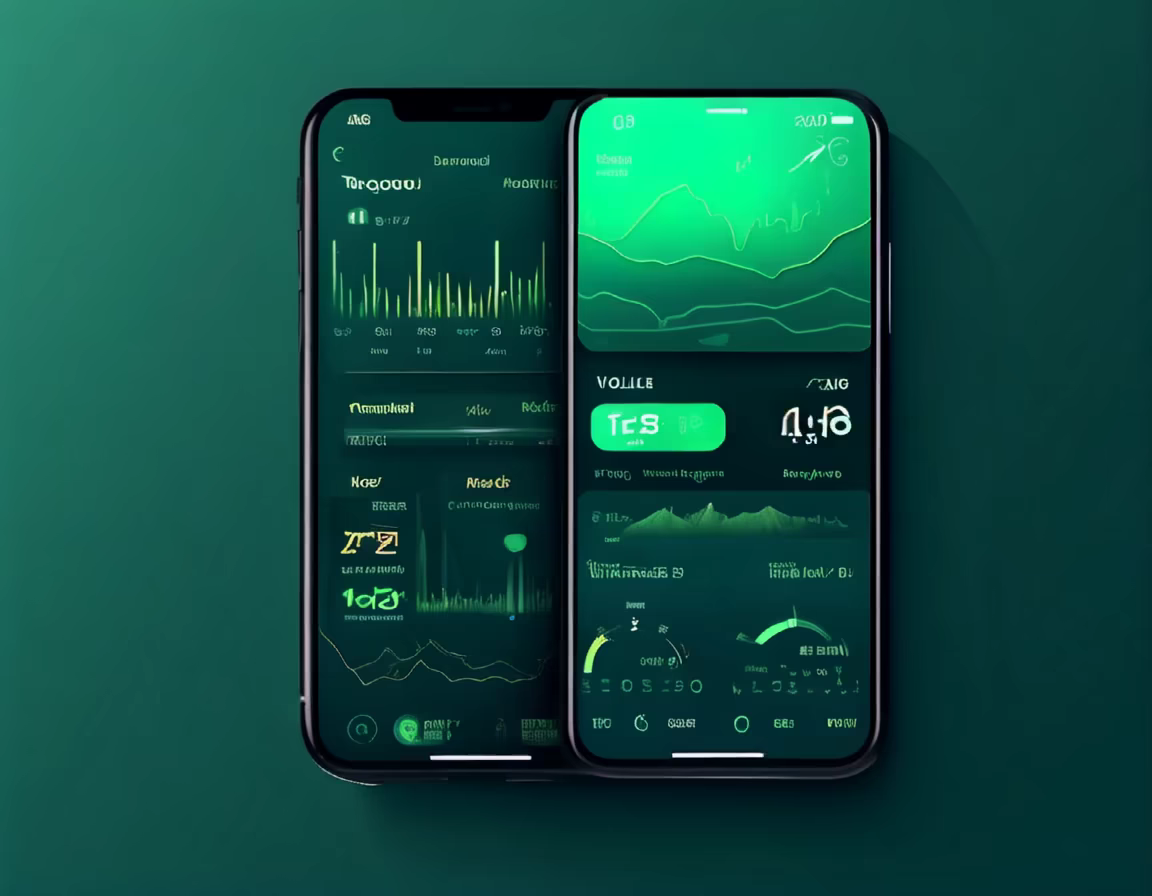
Prompt: an air filter app interface for a different functions and buttons on it UI/UX, figma, adobe, minimalist with logo and charts, functionality, stylist, performance chart, circles, without words


Prompt: an air filter app mobile interface for a different functions and buttons on it UI/UX, minimalist with logo and charts, functionality, stylist


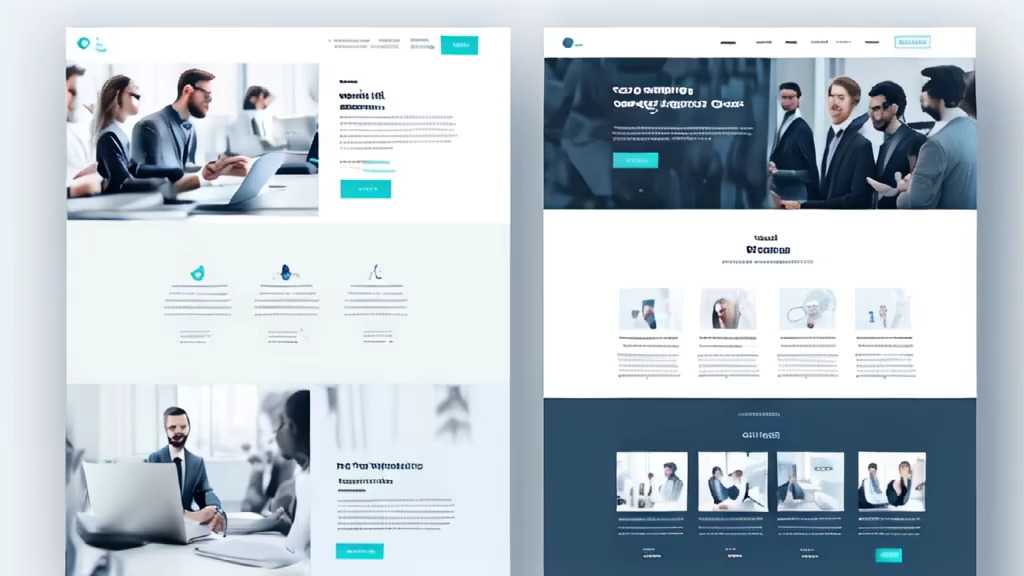
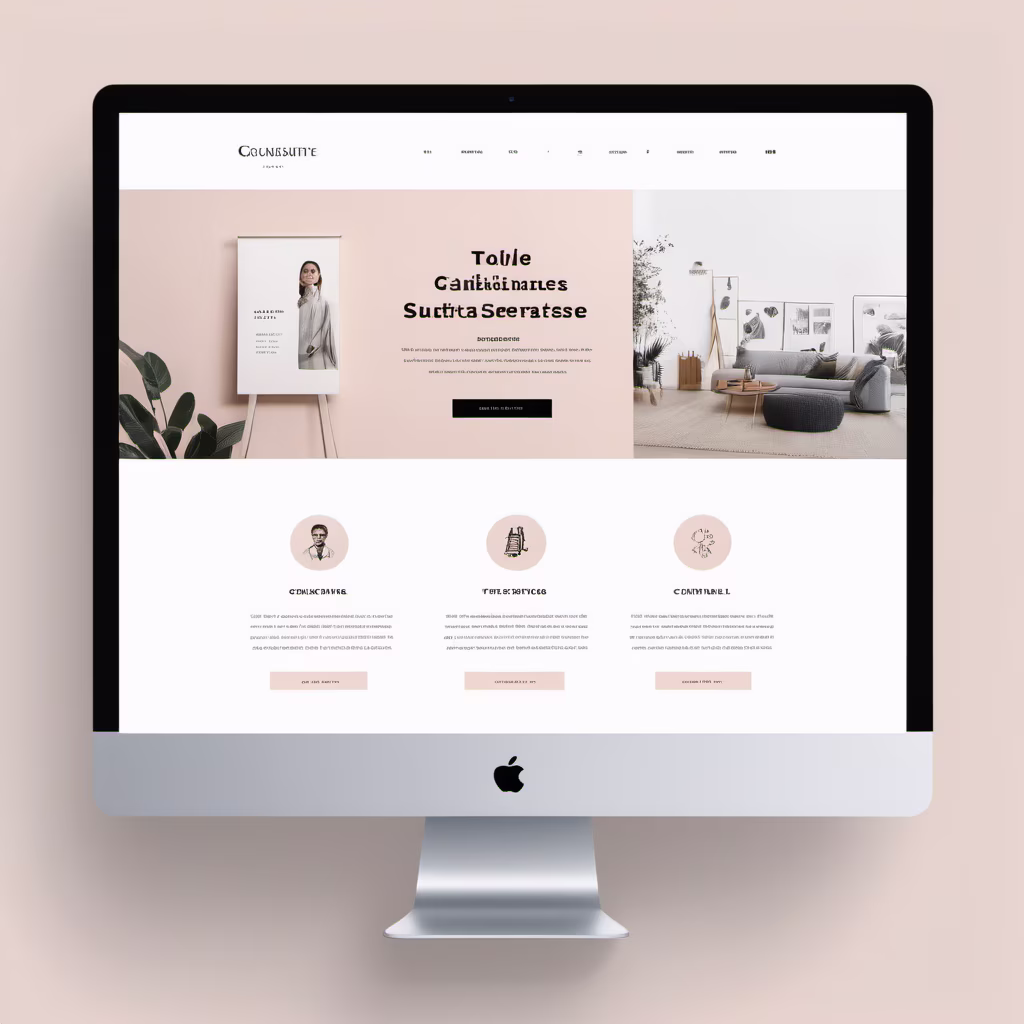
Prompt: A modern and elegant website user interface with a clean and intuitive design. The layout is user-friendly with clear navigation and concise text. The color palette is harmonious and visually appealing, using a combination of soft pastels and bold accents. The typography is well-chosen and easy to read, with a mix of serif and sans serif fonts. The images and graphics are high-quality and relevant to the content. The overall aesthetic is professional and sophisticated, conveying a sense of trust and credibility. front view


Prompt: A modern and elegant website user interface with a clean and intuitive design. The layout is user-friendly with clear navigation and concise text. The color palette is harmonious and visually appealing, using a combination of soft pastels and bold accents. The typography is well-chosen and easy to read, with a mix of serif and sans serif fonts. The images and graphics are high-quality and relevant to the content. The overall aesthetic is professional and sophisticated, conveying a sense of trust and credibility, theme for the website, such as minimalist, modern,

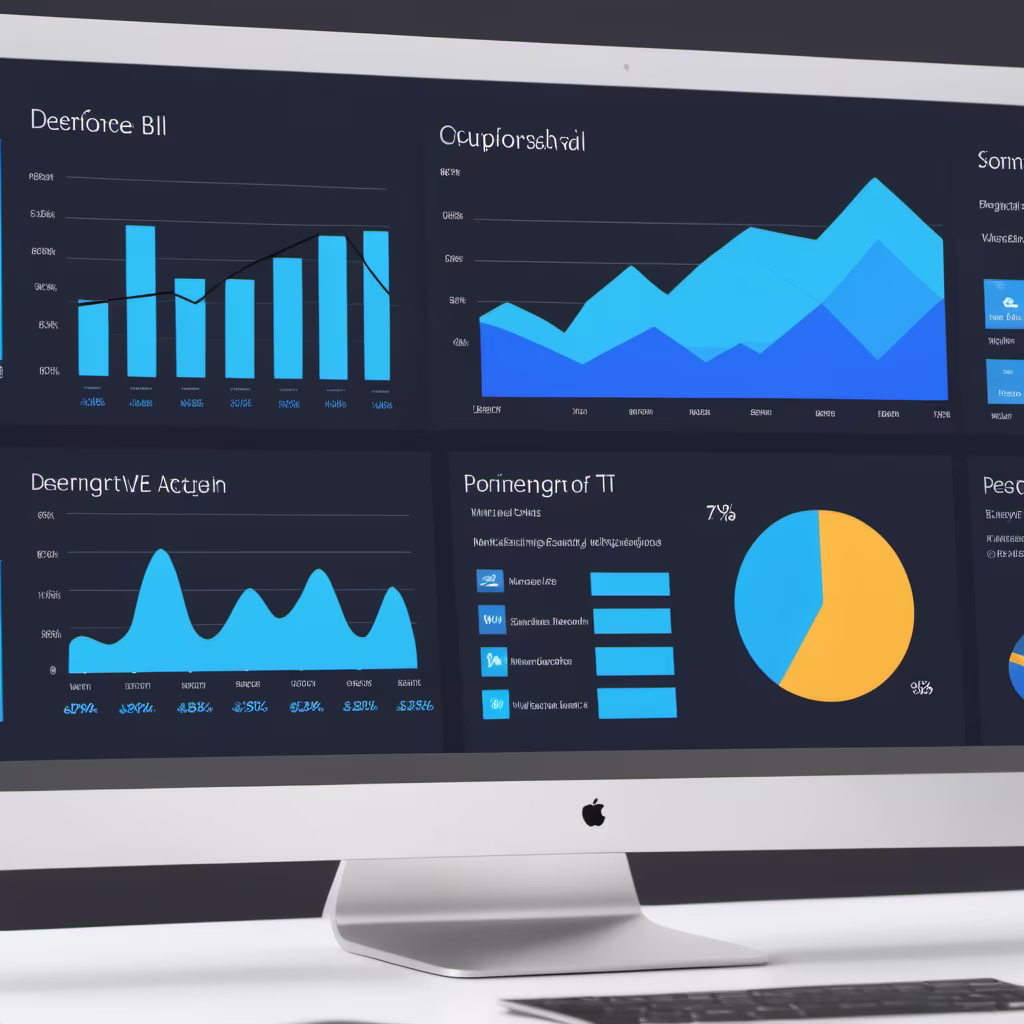
Prompt: \"Market Overview - Create an informative visual representation of a market overview. The image should convey key data, trends, and insights about a specific market or industry. Medium: Visual market overview representation. Style: Choose a style that communicates professionalism and data-driven insights. Resolution: High-quality to ensure clarity of data. --ar 16:9 --v 5.1 --style informative --q 2 --s 750.
Prompt: scientific research, flowchart illustration, serious and realistic style, uniform format, smooth preocess, simple and clear, scientific style, no text, realistic style, no artistic processing, flowchart design,


Prompt: Generate a promotional poster image, with blue as the main color, and some illusory backgrounds with a modern and technological feel. The transparency is below 30%, highlighting the theme of data intelligence, without small icon elements, introducing digital technology elements, and emphasizing numbers. For an ecological theme, don’t have concrete icons, 8k high definition.
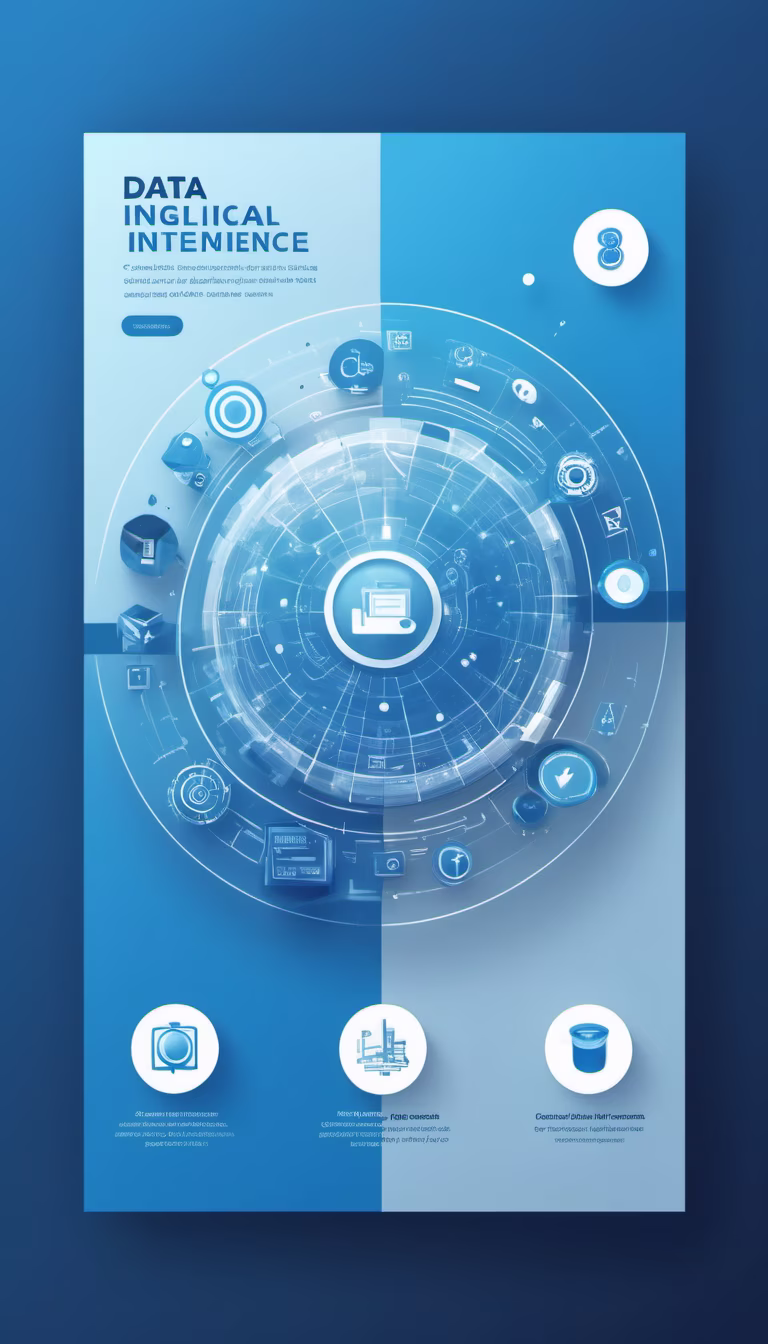


Prompt: Generate a promotional poster image, with blue as the main color, and some illusory backgrounds with a modern and technological feel. The transparency is below 30%, highlighting the theme of data intelligence, without small icon elements, introducing digital technology elements, and emphasizing numbers. For an ecological theme, don’t have concrete icons, 8k high definition.


Prompt: Create an INFORGRAPHY for a personal finance guide that offers practical advice on budgeting, investing, and building wealth. The design should exude professionalism and financial success. Use sleek and modern design elements. Include the Main title 'Financial Mastery: Wealth Building Strategies' and the author's name \"faheem\"' on the Design.


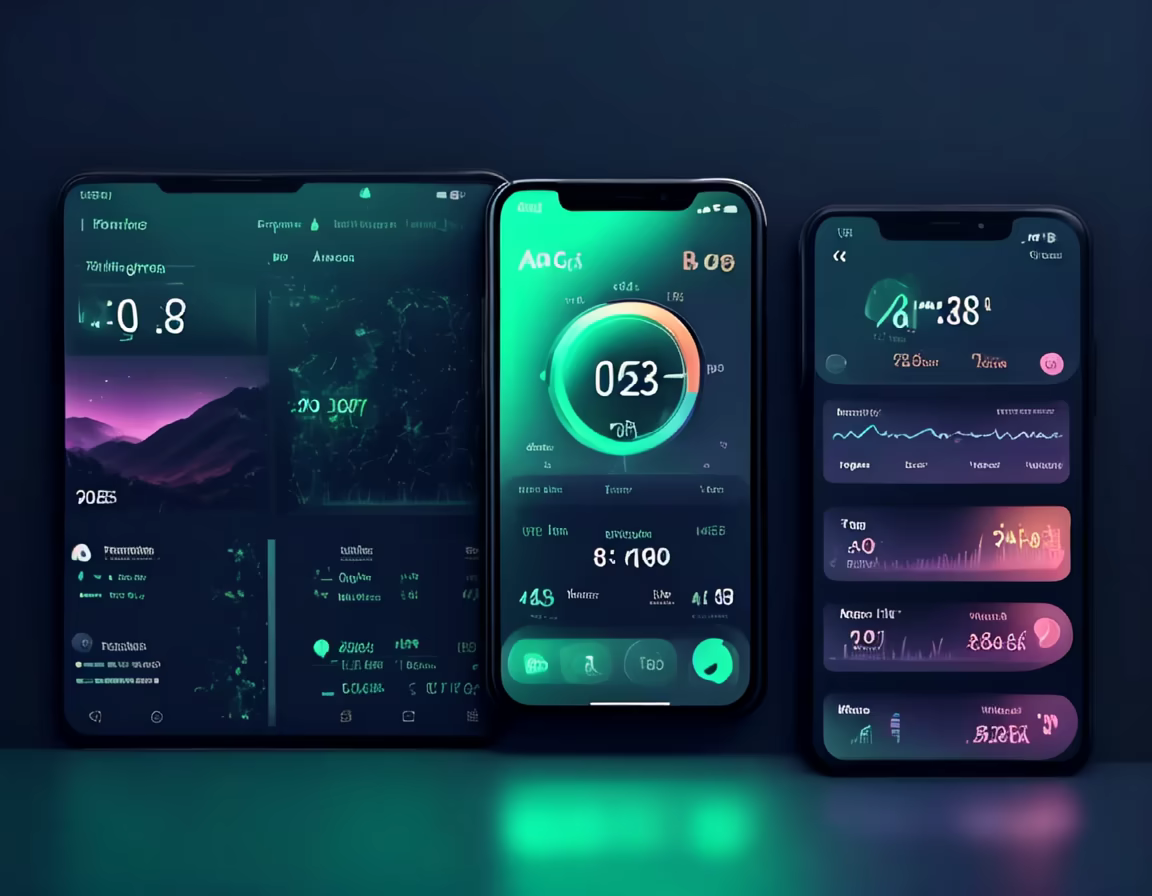
Prompt: background image for mobile app dashboard showing temperature and voltage and ambient temperature, green eco theme, car theme, pastel colours


Prompt: background image for mobile app dashboard showing temperature and voltage and ambient temperature, green eco theme, car theme, pastel colours


Prompt: Create an AI-generated image for a light mode, clean and modern hero section of an IT consulting website. The hero section should have a strong focus on UI design, with creative animation elements incorporated. The image should captivate viewers with its sleek and professional look, while also conveying the innovative and dynamic nature of the IT consulting industry. The design should effectively highlight key information and call-to-action elements, making it visually engaging and compelling for website visitors. The use of vibrant colors and subtle gradients is welcomed to create a visually appealing composition. The image should exude professionalism, trustworthiness, and a sense of technological expertise. Overall, the AI-generated image should reflect a cutting-edge and forward-thinking approach to IT consulting website design.
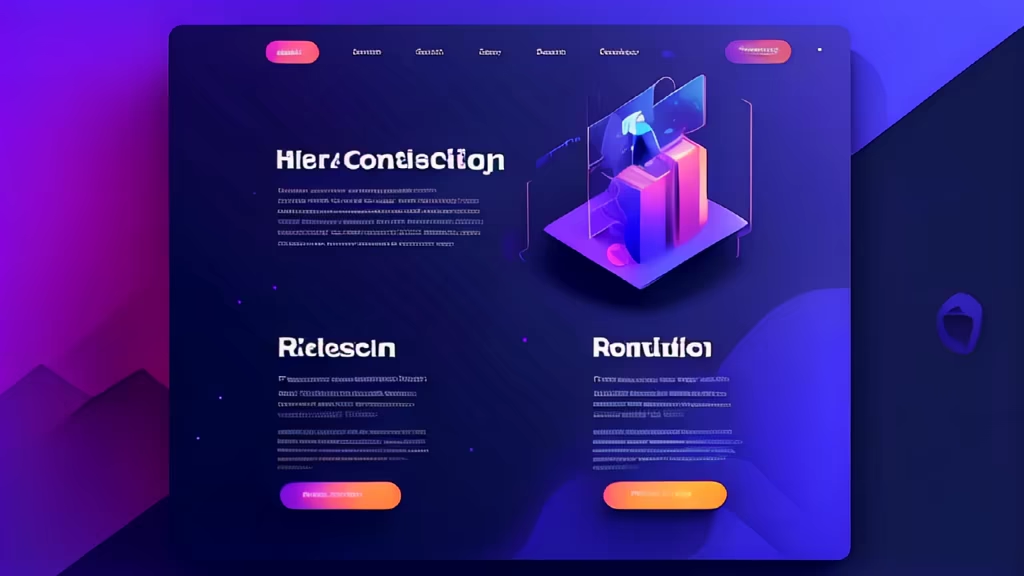
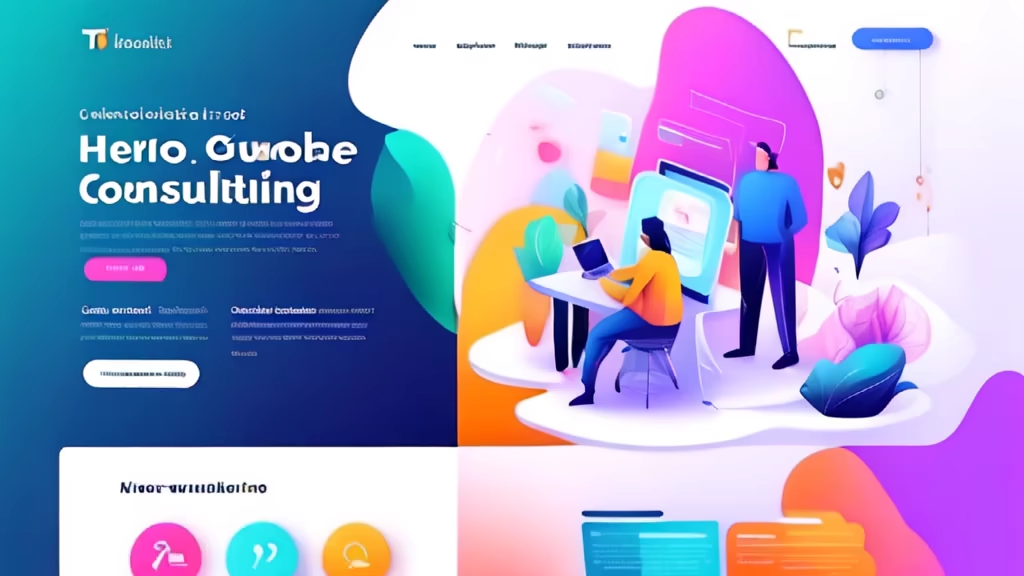
Prompt: Create an AI-generated image for a light mode, clean and modern hero section of an IT consulting website. The hero section should have a strong focus on UI design, with creative animation elements incorporated. The image should captivate viewers with its sleek and professional look, while also conveying the innovative and dynamic nature of the IT consulting industry. The design should effectively highlight key information and call-to-action elements, making it visually engaging and compelling for website visitors. The use of vibrant colors and subtle gradients is welcomed to create a visually appealing composition. The image should exude professionalism, trustworthiness, and a sense of technological expertise. Overall, the AI-generated image should reflect a cutting-edge and forward-thinking approach to IT consulting website design.


Prompt: illustration, globalization impact, global,city, light blue,green and yellow,globalization,Carbon neutrality, carbon peak, zero carbon emissions,energy conservation and emission reduction


Prompt: Design an infographic that visually communicates Universe Magazine's mission and values. Include the following key elements:Core Elements: Highlight the pillars of Universe Magazine's mission—illumination of basic science, mathematics research, and engineering science through public service journalism.Disciplinary Coverage: Illustrate the diverse scientific disciplines covered, such as mathematics, theoretical physics, computer science, life sciences, technology, engineering, and social impact areas.Editorial Independence: Emphasize the commitment to editorial independence, showcasing the magazine's dedication to impartial and responsible journalism.Multilingual Accessibility: Represent the inclusivity of Universe Magazine by incorporating visuals or icons to signify its articles written in multiple languages, including English, French, Arabic, Chinese, Portuguese, Spanish, and local African languages.Global Reach: Depict the global perspective of Universe Magazine by incorporating elements that represent the international scope of its coverage.Scientific Accuracy: Convey the importance of scientific accuracy in the magazine's content creation process through icons or visuals that represent meticulous research, fact-checking, and editorial integrity.Engagement and Community: Illustrate the interactive nature of Universe Magazine by including icons or visuals that represent reader engagement, comments, and a sense of community.Mission Quote: Include a prominent quote reflecting the essence of Universe Magazine's mission, such as \"Understanding The Universe\" or an excerpt from Albert Einstein about the comprehensibility of the world.


Prompt: Design an infographic that visually communicates Universe Magazine's mission and values. Include the following key elements:Core Elements: Highlight the pillars of Universe Magazine's mission—illumination of basic science, mathematics research, and engineering science through public service journalism.Disciplinary Coverage: Illustrate the diverse scientific disciplines covered, such as mathematics, theoretical physics, computer science, life sciences, technology, engineering, and social impact areas.Editorial Independence: Emphasize the commitment to editorial independence, showcasing the magazine's dedication to impartial and responsible journalism.Multilingual Accessibility: Represent the inclusivity of Universe Magazine by incorporating visuals or icons to signify its articles written in multiple languages, including English, French, Arabic, Chinese, Portuguese, Spanish, and local African languages.Global Reach: Depict the global perspective of Universe Magazine by incorporating elements that represent the international scope of its coverage.Scientific Accuracy: Convey the importance of scientific accuracy in the magazine's content creation process through icons or visuals that represent meticulous research, fact-checking, and editorial integrity.Engagement and Community: Illustrate the interactive nature of Universe Magazine by including icons or visuals that represent reader engagement, comments, and a sense of community.Mission Quote: Include a prominent quote reflecting the essence of Universe Magazine's mission, such as \"Understanding The Universe\" or an excerpt from Albert Einstein about the comprehensibility of the world.


Prompt: Create a blue image featuring an icon for digital analysis and a bar chart. The image should be simple and clear, suitable as an illustration for a PowerPoint presentation


Prompt: Create a short, professional video of 30 secondes with animated graphics illustrating the flow of funds into environmentally sustainable projects. Emphasize the global impact of climate finance and the positive changes it can bring. Use a concise and compelling voiceover to explain the importance of financial support in combating climate change.
Prompt: Create an INFORGRAPHY for a personal finance guide that offers practical advice on budgeting, investing, and building wealth. The cover should exude professionalism and financial success. Use sleek and modern design elements with images of currency or financial charts. Include the book title 'Financial Mastery: Wealth Building Strategies' and the author's name 'David P. Finance' on the cover.


