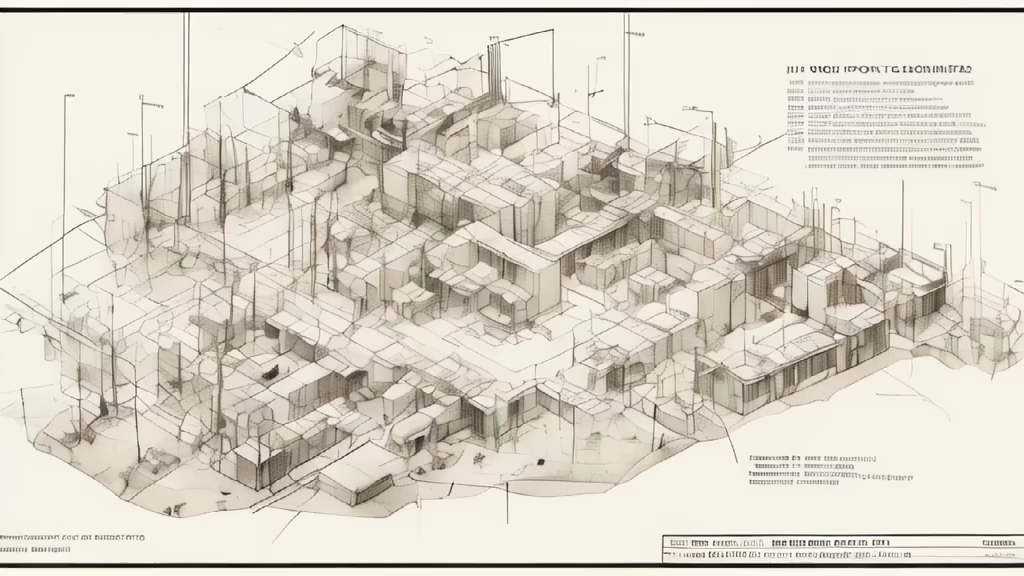
Prompt: Please provide a 3D view of a Plackett-Burman table, for instance, as a generic image to illustrate a course on experimental design

Prompt: Please provide a 3D view of a tagushi table, for instance, as a generic image to illustrate a course on experimental design


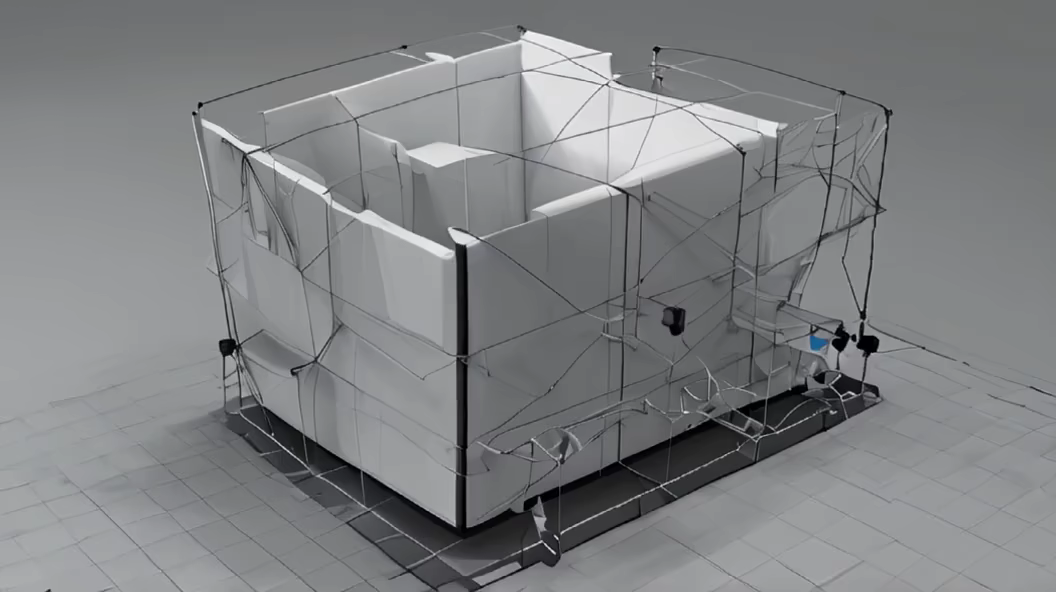
Prompt: Dreaming for \u003c@!1077971708591493191\u003e... `/dream prompt:Create a generic image for the cover of a mathematics book on Design of Experiments (DOE). I'd like a 3D view of an experimental design with the numbers -1 and +1 repeated multiple times. I want adequacy plots in the background seed:3324034466`

Prompt: Create a generic image for the cover of a mathematics book on Design of Experiments (DOE). I'd like a 3D view of an experimental design with the numbers -1 and +1 repeated multiple times. I want adequacy plots in the background


Prompt: The study employed a randomized controlled design with a sample size of 200 participants. Results were analyzed using multivariate regression analysis, revealing a statistically significant relationship between the independent and dependent variables. Findings are discussed in detail in the subsequent sections


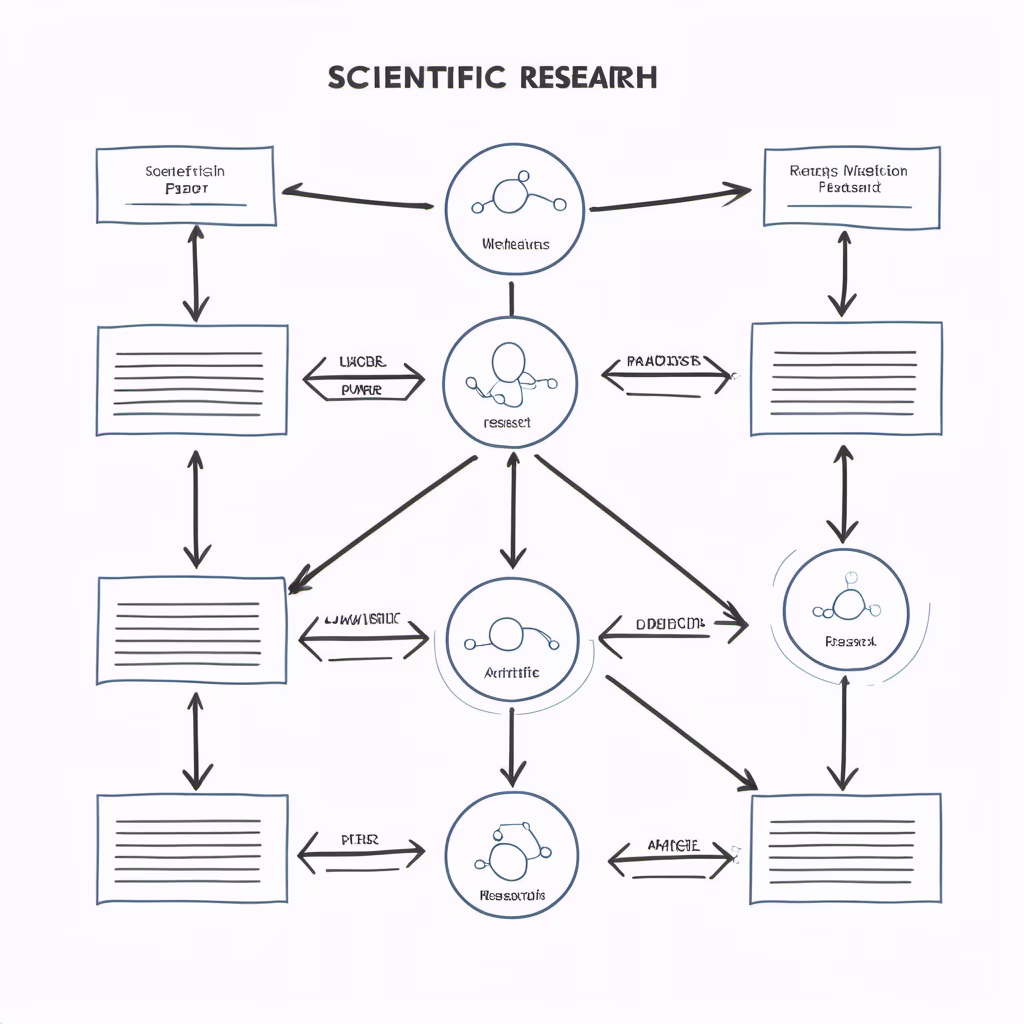
Prompt: flow diagram for a scientific research paper, no text in the picture, sketch style, no artistic processing,

Prompt: Schémas numériques couplés à de l’apprentissage machine pour la résolution d'équations aux dérivées partielles


Prompt: schematic illustrates transition zone of functionally graded material, the transition zone is varying continuously from one material to another , one object, clear and concise without words


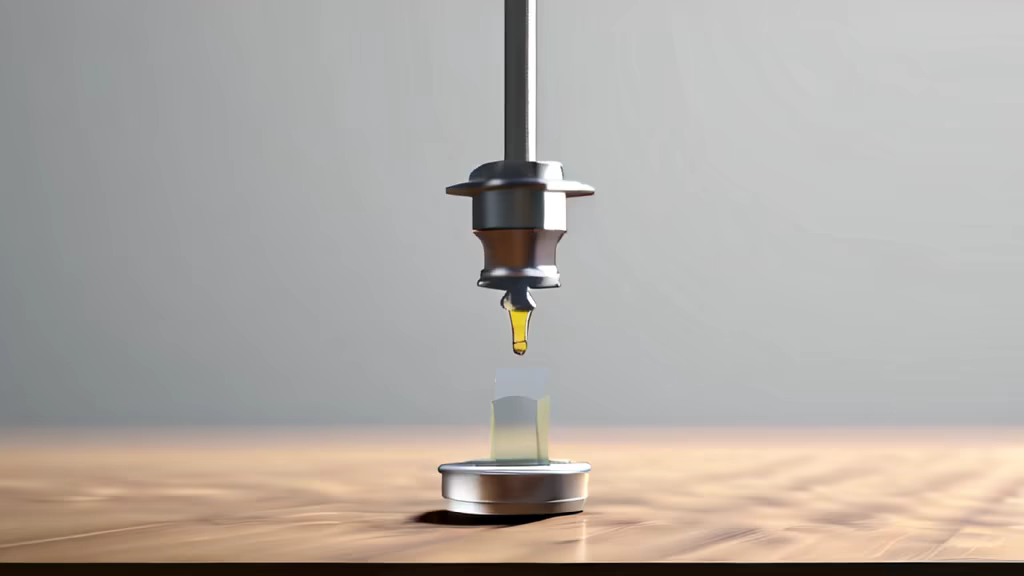


Prompt: Help me draw a testing link diagram, with the instruments placed in the order of 1 laser, 2 polarization controller, 3 chip, 4 photodetector


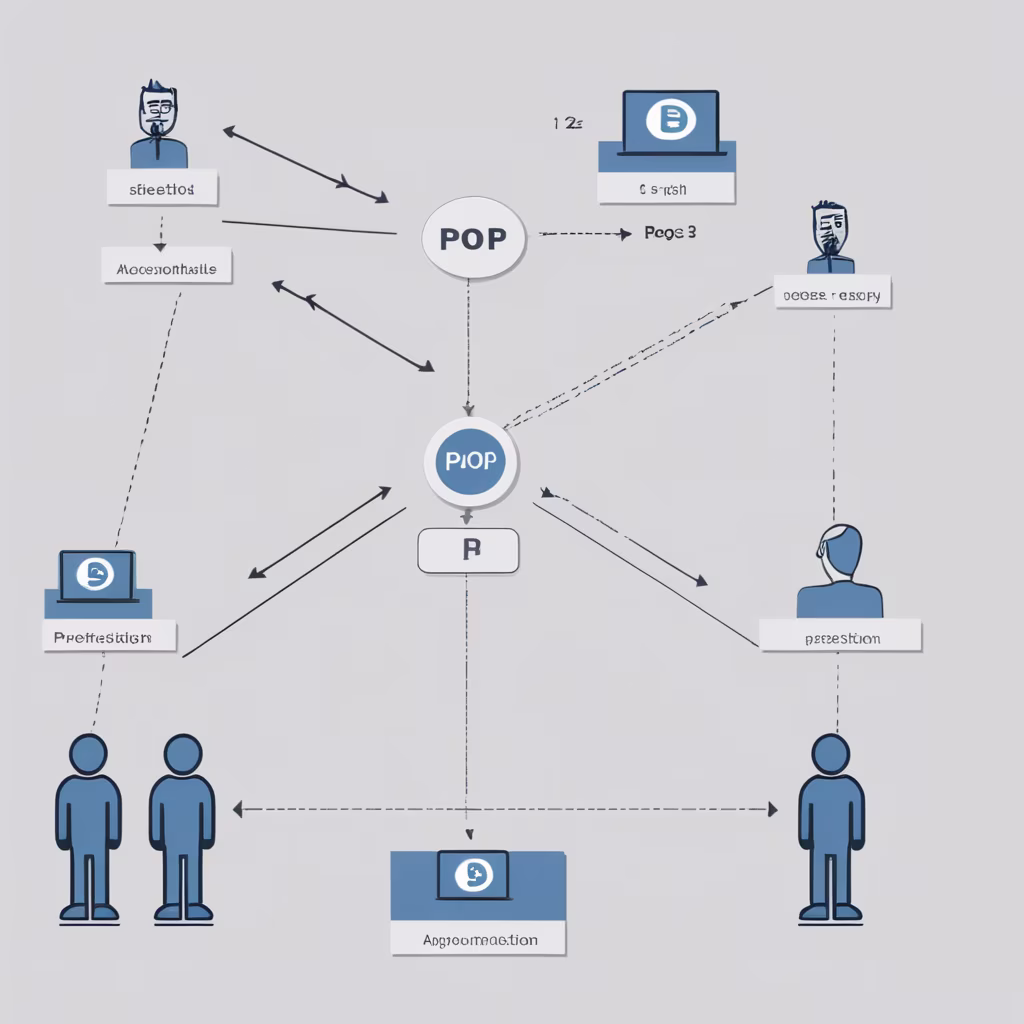
Prompt: Figure Title: Dynamic Feedback Loop in [Specify the System or Process] Caption: Figure 1: Illustration of a standard feedback loop within the [Specify System or Process]. Arrows indicate the direction of influence. Description: This figure visually represents a standard feedback loop inherent in the [Specify System or Process], showcasing the dynamic interactions between its key components. The feedback loop is crucial for understanding the system's self-regulating behavior. 1. Components: The figure comprises three main components: [Input], [Process], and [Output]. [Input] represents the initial stimuli or conditions that initiate the process. [Process] embodies the series of actions or transformations that occur within the system. [Output] denotes the resulting outcomes or effects produced by the system. 2. Arrows and Directionality: Arrows connect the components, indicating the flow of information or influence. An arrow from [Input] to [Process] signifies the impact of external factors on the ongoing process. An arrow from [Process] to [Output] represents the outcomes generated by the system. 3. Feedback Loop: A loop is formed by an additional arrow from [Output] back to [Input]. This loop signifies the feedback mechanism, wherein the system's outputs influence its inputs, creating a continuous cycle. Positive feedback amplifies deviations from the system's equilibrium, potentially leading to dynamic behavior. Negative feedback dampens deviations, promoting stability within the system. 4. Labels and Annotations: Each component is labeled clearly, ensuring easy identification. Relevant annotations provide additional information about specific processes or feedback mechanisms. 5. Time Dimension: The figure may include a temporal element, with the progression of time depicted along the feedback loop. This emphasizes the dynamic nature of the system and how it evolves over time. 6. Contextualization: A brief description in the main text contextualizes the figure, explaining its relevance to the overall study. The figure might be referenced when discussing system behavior, adaptability, or response to external stimuli. 7. Aesthetic Considerations: The figure maintains a clear and professional aesthetic, adhering to any formatting guidelines specified by the journal. Colors, if used, are chosen purposefully to enhance clarity without sacrificing scientific rigor. By incorporating these elements, the figure effectively communicates the concept of a standard feedback loop in the specified system or process. It serves as a valuable visual aid for readers to grasp the interconnected dynamics and regulatory mechanisms at play within the scientific context.


Prompt: A balance scale with one side showing a single, shining post and the other multiple dull posts, illustrating quality over quantity


Prompt: schematic illustrates transition zone of functionally graded material, the transition zone is varying continuously from one material to another ,clear and concise without words


Prompt: A figure to be attached to an scientific article describing chain of thought process in context of reasoning in large language models