Prompt: create a data visualization graphic to visualize two data points: \"(1) Coname technology is operating in 100+ facilities, including hospitals, schools, commercial + residential bldgs., industrial facilities, and an MLB stadium. (2) In total, Coname technology is deployed in facilities totaling 10 million+ sq ft of building space.\"


Prompt: create a simple, colorful data visualization graphic to visualize two data points: (1) 100+ building facilities (2) 10 million+ sq ft of building space.


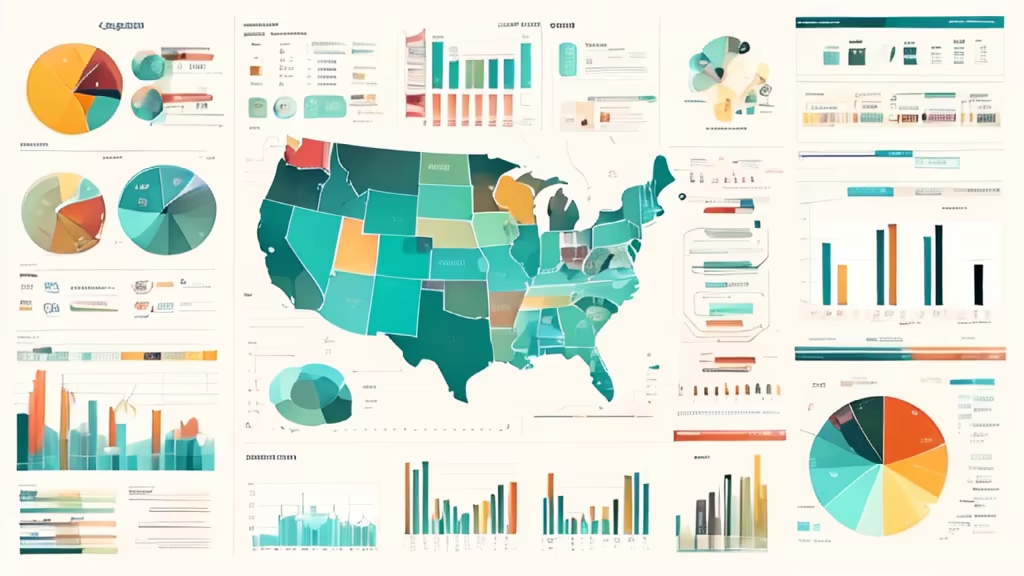
Prompt: \"Market Overview - Create an informative visual representation of a market overview. The image should convey key data, trends, and insights about a specific market or industry. Medium: Visual market overview representation. Style: Choose a style that communicates professionalism and data-driven insights. Resolution: High-quality to ensure clarity of data. --ar 16:9 --v 5.1 --style informative --q 2 --s 750.
Prompt: Create a visually striking C4D icon, showcasing a sleek technological base with embedded microchips, accompanied by a seamlessly integrated data table. Illustrate the concept of a dynamic system in action, symbolizing the synergy between advanced computing, data processing, and cloud services.


Prompt: The detailed flat map of an entire hospital complex, designed in a style suitable for architectural purposes and allowing for zooming into every single room that occupy different medical specialty, pixel art , aspect ratio : 1:1


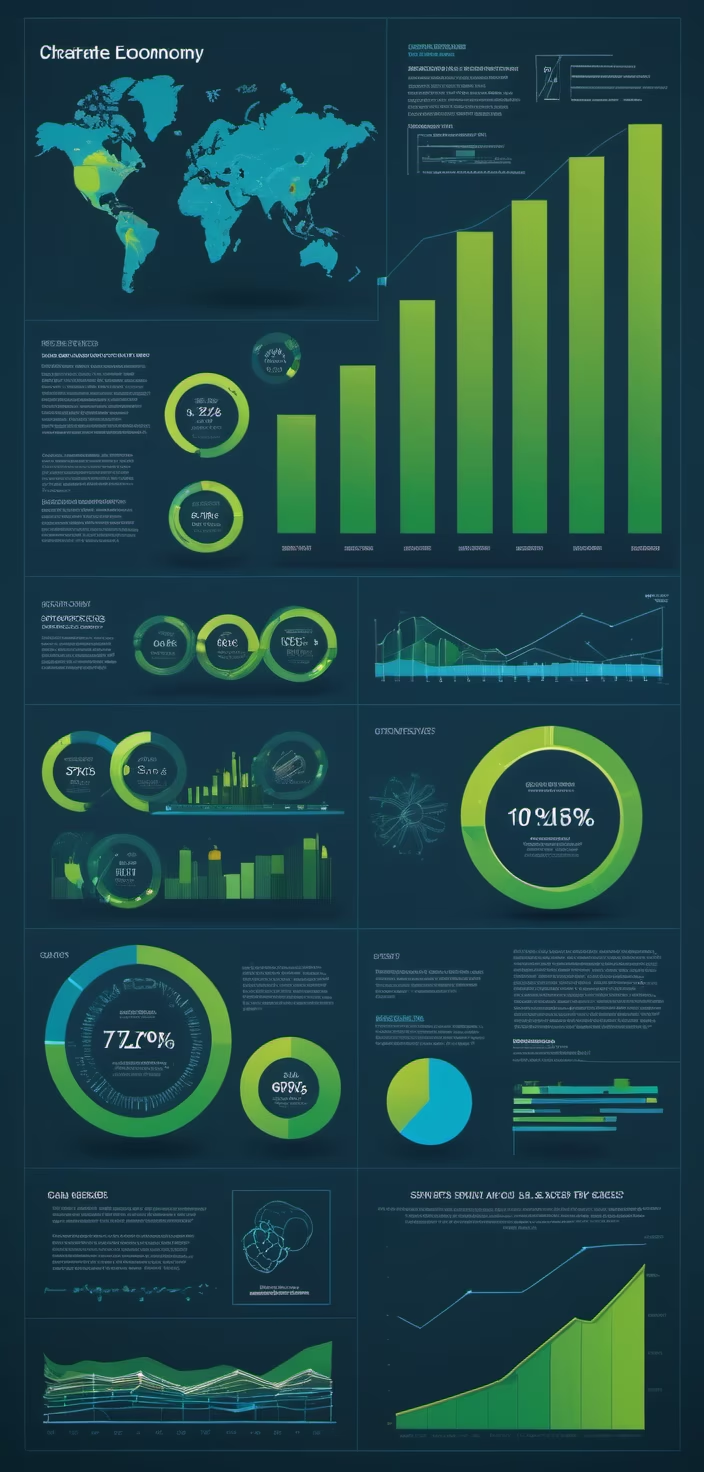
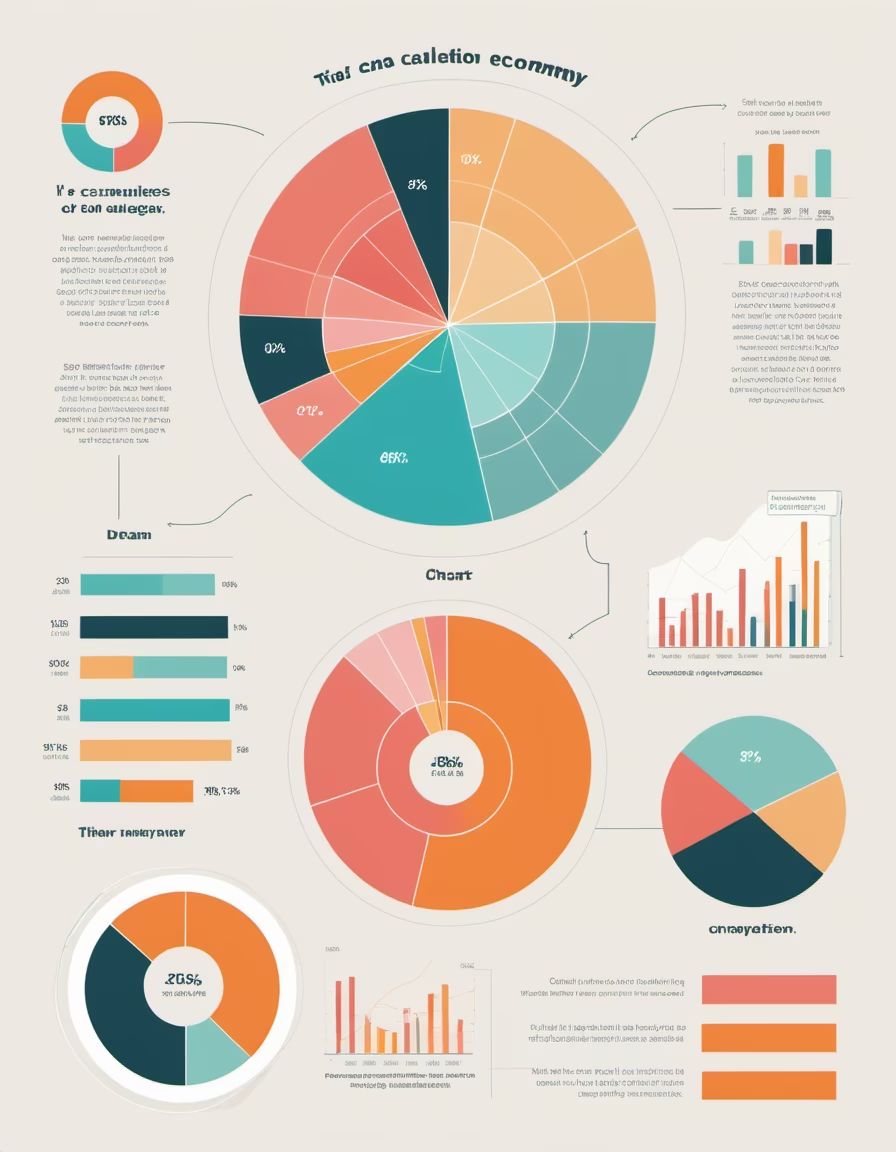
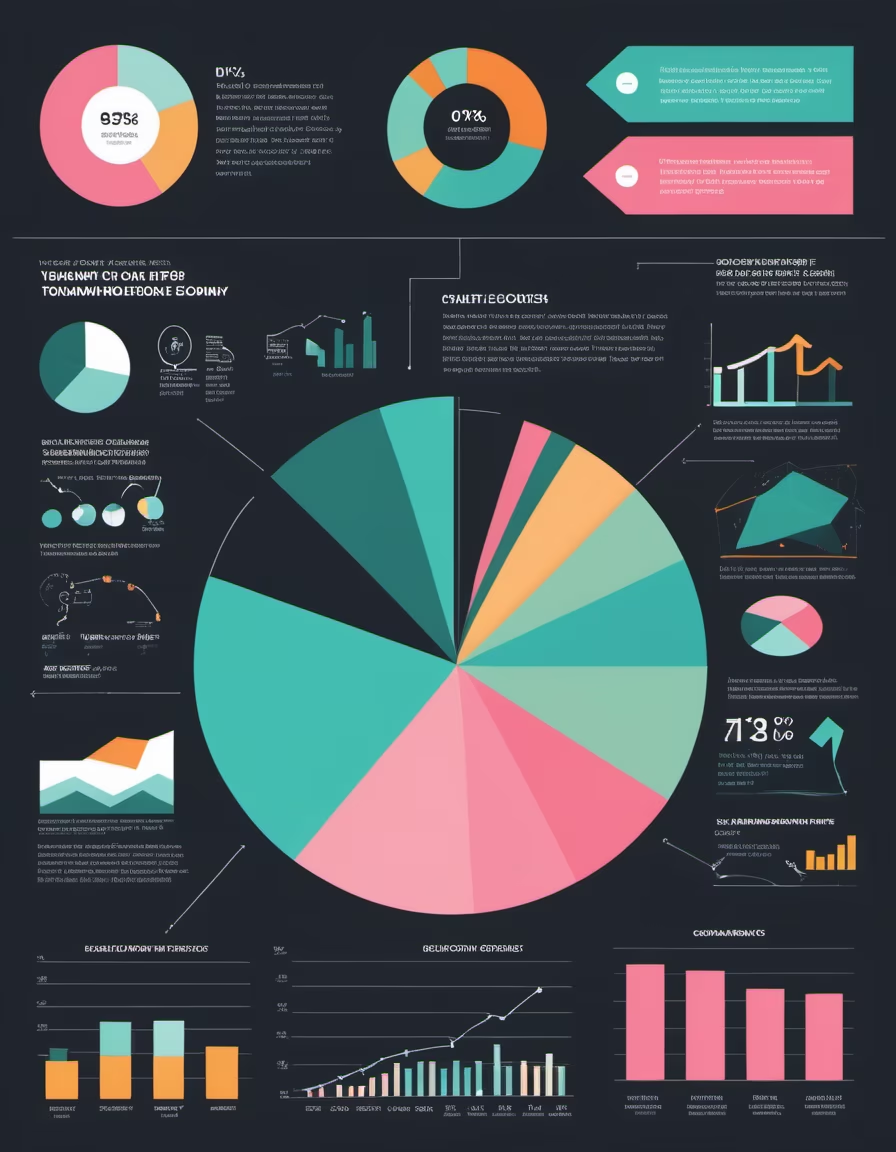
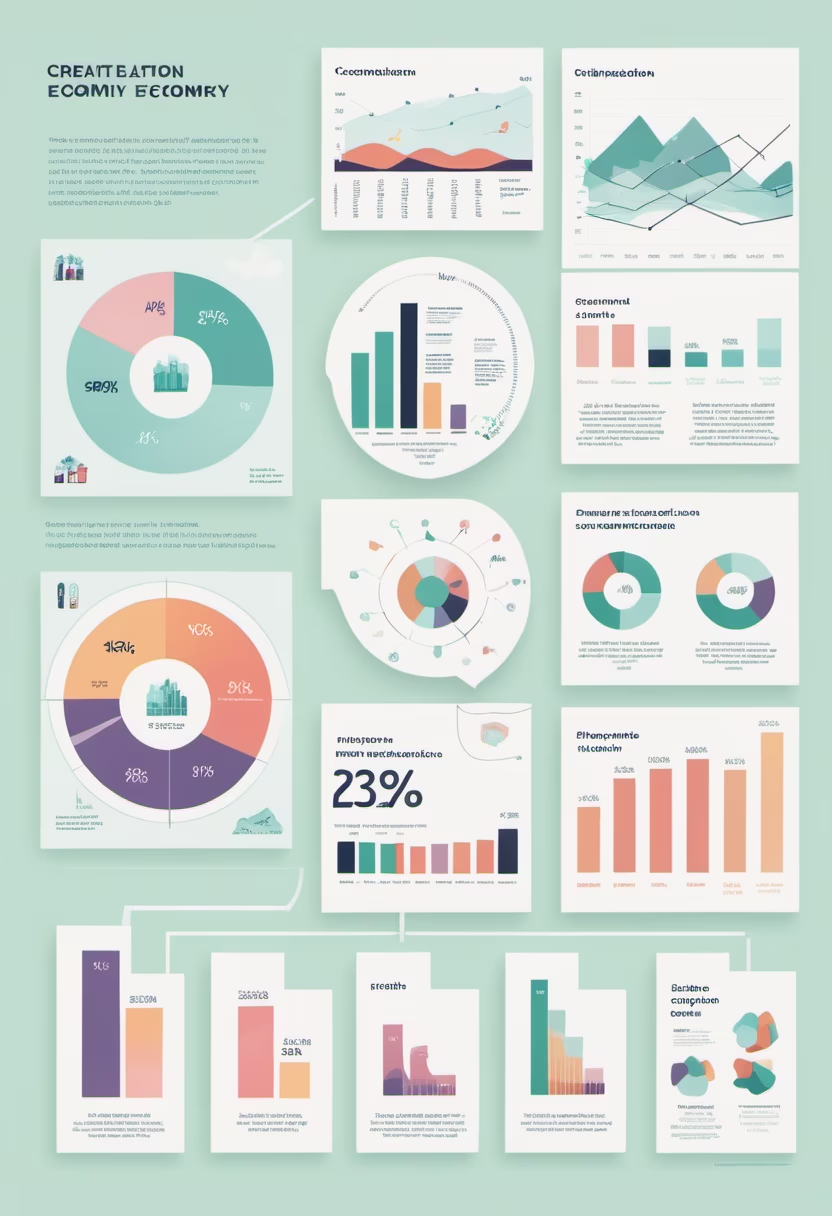
Prompt: create a visualization infographic to show opportunities and challenges of a low-carbon economy, data visualization, charts, graphs, high contrast, light background


Prompt: A cutting-edge software interface displaying medical data exploration. The focal point is a dynamic display of patient information with interactive features, cg, high-tech, sleek, user-friendly, interactive, illuminated, transparent overlays, holographic elements.


Prompt: Create a visually striking C4D icon, showcasing a sleek technological base with embedded microchips, accompanied by a seamlessly integrated data table. Illustrate the concept of a dynamic system in action, symbolizing the synergy between advanced computing, data processing, and cloud services


Prompt: Create a visually striking C4D icon, showcasing a sleek technological base with embedded microchips, accompanied by a seamlessly integrated data table. Illustrate the concept of a dynamic system in action, symbolizing the synergy between advanced computing, data processing, and cloud services


Prompt: Generate an icon for a tech consulting company, focusing on a stable diffusion theme within the context of an \"L\" shape. The icon should seamlessly integrate tech elements, such as circuit lines or modern design, to represent the company's expertise in the tech consulting space. Emphasize stability and diffusion to convey the idea of the company's solutions spreading reliably in the digital realm. Consider the use of a sleek and scalable design that would be suitable for various applications, from digital platforms to printed materials. Colors should be chosen with a modern and professional aesthetic in mind.


Prompt: A graphic showcasing a streamlined conveyor belt system could aptly represent the game's content mechanism. The conveyor belt smoothly transports unique game assets on one side, symbolizing the prevention of duplicates. Concurrently, it seamlessly integrates previously used components from the other end, emphasizing the efficient reuse of existing assets. This imagery encapsulates the game's structured approach, ensuring innovation while optimizing resources.


Prompt: dream prompt:create a visualization infographic to show opportunities and challenges of a low-carbon economy, data visualization, charts, graphs, modern design


Prompt: a rectangular structure with various components, such as LED walls, VR stations, touch monitors, and iPads. The structure has a height of 1.7 meters, a width of 0.55 meters, and a depth of 0.5 meters. The structure has two options for placing LED walls on the sides, and a VTM module on the top. The structure also has four VR stations arranged vertically next to the VTM module. The structure has areas for touch monitors and iPads on the front and back sides. The structure has an arrow pointing to one side, indicating some modification or adjustment needed on that side. This is a Cabinet.


Prompt: Certainly! Here are the keywords separated by commas: 3D screen interface, Deep blue data visualization, Dynamic 3D data display, Richly detailed information graphics, Immersive 3D data experience, Data-rich holographic screens, Deep blue knowledge projection, Comprehensive 3D data representation, Blue-hued interactive data screens, Information depth in 3D, Detailed data visualization on 3D screens, Interactive 3D information landscapes, Earth-centric 3D data models, Deep blue 3D data architecture, Celestial data insights on 3D screens, Advanced 3D data exploration, Blue spectrum 3D information retrieval, Enriched data presentation in 3D, Infinite depth 3D data ecosystem, Cutting-edge 3D knowledge display.


Prompt: create a visualization infographic to show opportunities and challenges of a low-carbon economy, data visualization, charts, graphs, high contrast, blue and green, white background


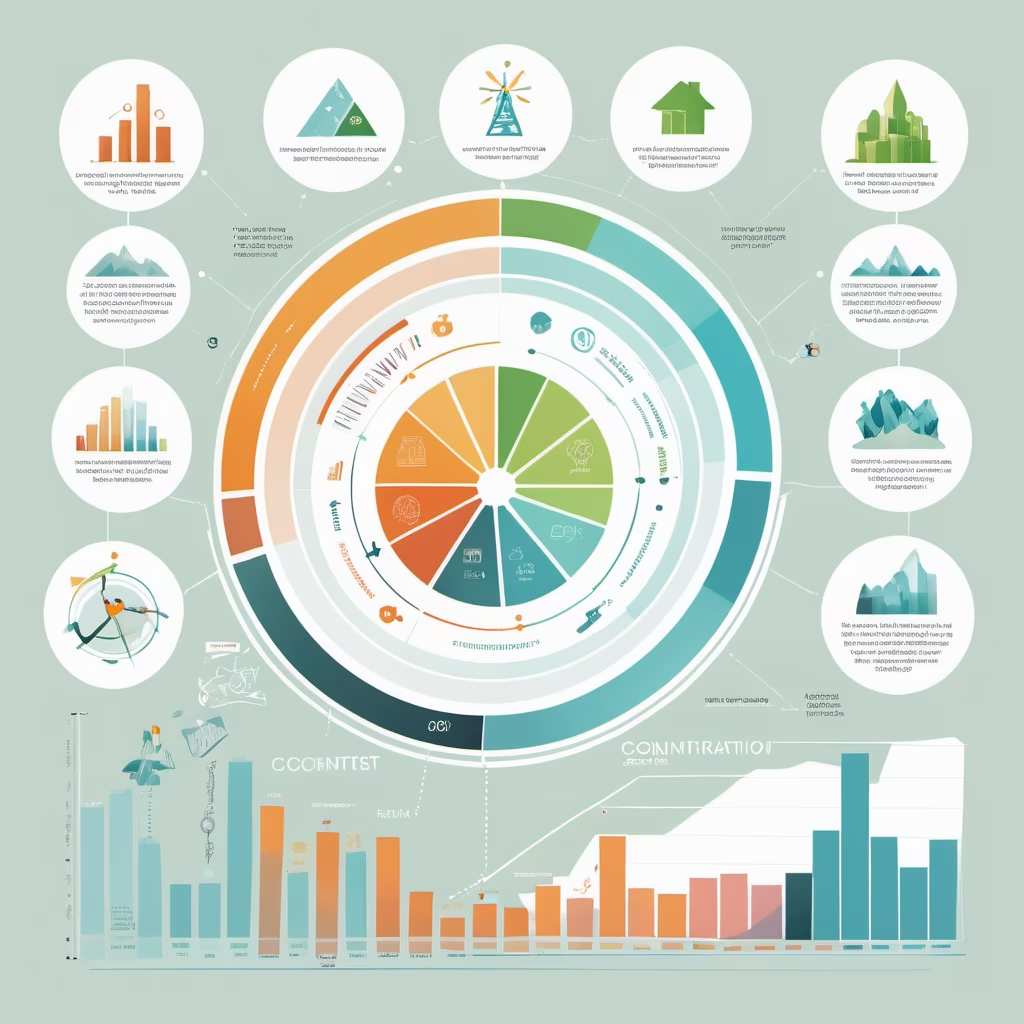
Prompt: create a visualization infographic to show opportunities and challenges of a low-carbon economy, data visualization, charts, graphs, icons,pastel colors,modern design


Prompt: \"A meticulously designed statistical chart capturing the essence of Britain while illustrating crime rate trends.\"\"Incorporation of iconic British symbols and landmarks into the chart's visual elements.\"\"Line graphs elegantly tracing the rise and fall of crime rates over time, surrounded by elements inspired by British architecture.\"\"Bar graphs showcasing comparative analysis of crime rates across different regions or years, adorned with accents inspired by British heraldry.\"\"Color-coded sections reflecting the diverse categories of crimes, accompanied by subtle nods to the British flag's colors.\"\"Annotations and labels providing insightful context and explanations with a touch of British linguistic charm.\"\"A visually captivating representation that highlights the impact of crime rates on British society and the political landscape.\"\"A powerful tool for political parties and policymakers to recognize the significance of addressing crime rates in the context of the United Kingdom.\"—c 10 —ar 2:3


Prompt: create a visualization infographic to show opportunities and challenges of a low-carbon economy, data visualization, charts, graphs, high contrast, blue and green, light background

Prompt: Generate a realistic image of a small-scale commercial building under construction on a tight budget. Highlight the simplicity and efficiency of the construction process, emphasizing cost-effective design elements. Showcase the integration of basic infrastructure, signage, and minimalistic landscaping.


Prompt: Picture a fluid mosaic of interconnected pathways and bridges, representing the streamlined systems. The mechanics are symbolized by a series of interconnected, smooth-flowing channels, highlighting the seamless flow of operations. User-friendly controls are illustrated through intuitive touchpoints, emphasizing the ease of navigation. Best practices in interface design manifest as clear signposts and markers along the pathways, guiding users with simplicity. Important information is displayed prominently, akin to well-lit landmarks in the visual landscape.


Prompt: cartoon version of a large digital age customer-first hospital with a lot of kiosks, screens and tablets with no counters few patients with lot of consultation rooms and wards, allowing easy access, medical hospital, kiosks, screens , convenience, beautiful, masterpiece, 8k, high quality
Negative: crowd
Style: Anime


Prompt: Generate an image showcasing the dynamic talent acquisition cycle in the oil and gas industry. Visualize the stages, from workforce planning and job role definition to recruitment strategy and candidate onboarding. Feature diverse professionals engaged in technical interviews, negotiations, and onboarding sessions. Highlight the integration of cutting-edge technology and industry-specific tools. Capture the essence of a vibrant and evolving talent ecosystem within the oil and gas sector, emphasizing the importance of skilled professionals in driving success and innovation


Prompt: create a visually stunning architecture diagram in poster format for a 5-story building design. I'm drawing inspiration from the Abu Dhabi Performing Art Center, with influences from precisionist art. The color scheme I have in mind is a striking combination of blue and white hues, aiming to convey a futuristic atmosphere that exudes technology and artificial intelligence. Can you assist me in generating a captivating architecture diagram based on these elements for my poster?


Prompt: A sleek, futuristic digital storage icon symbolizing efficiency and organization, with a constant flow of miniature game assets seamlessly entering a virtual realm. This icon showcases a stream of diverse content—icons, audio waves, and visual elements—merging into the storage, indicating minimal space consumption. The backdrop features a grid system, emphasizing organization, with assets interlocking to avoid duplication. This imagery captures the essence of a game's standardized content system, illustrating intelligent content addition and asset reuse, ensuring optimal disk space utilization.
Style: Digital Art


Prompt: A sleek, futuristic digital storage icon symbolizing efficiency and organization, with a constant flow of miniature game assets seamlessly entering a virtual realm. This icon showcases a stream of diverse content—icons, audio waves, and visual elements—merging into the storage, indicating minimal space consumption. The backdrop features a grid system, emphasizing organization, with assets interlocking to avoid duplication. This imagery captures the essence of a game's standardized content system, illustrating intelligent content addition and asset reuse, ensuring optimal disk space utilization.


Prompt: Visualize the expansion of Bilsan Business Solutions, with a focus on the growing team, new office spaces, and positive interactions with clients. Provide a detailed 4K scene that conveys the company's success and the energy of a thriving workplace.


Prompt: Generate a realistic image of an industrial container designed for the safe and efficient storage of blood in medical facilities. Emphasize the container's industrial-grade materials, safety features, and ensure that the overall design reflects a sterile and professional environment. Consider including details such as barcode labels, temperature monitoring systems, and any other features essential for the secure storage and transportation of blood products within the healthcare industry


Prompt: Generate a promotional poster image, with blue as the main color, and some illusory backgrounds with a modern and technological feel. The transparency is below 30%, flattened, highlighting the theme of data intelligence, without small icon elements, and introducing digital technological elements. , emphasizing the theme of digital ecology, not having concrete physical icons, 8k high definition.


Prompt: Generate a promotional poster image, with blue as the main color, and some illusory backgrounds with a modern and technological feel. The transparency is below 30%, flattened, highlighting the theme of data intelligence, without small icon elements, and introducing digital technological elements. , emphasizing the theme of digital ecology, not having concrete physical icons, 8k high definition.


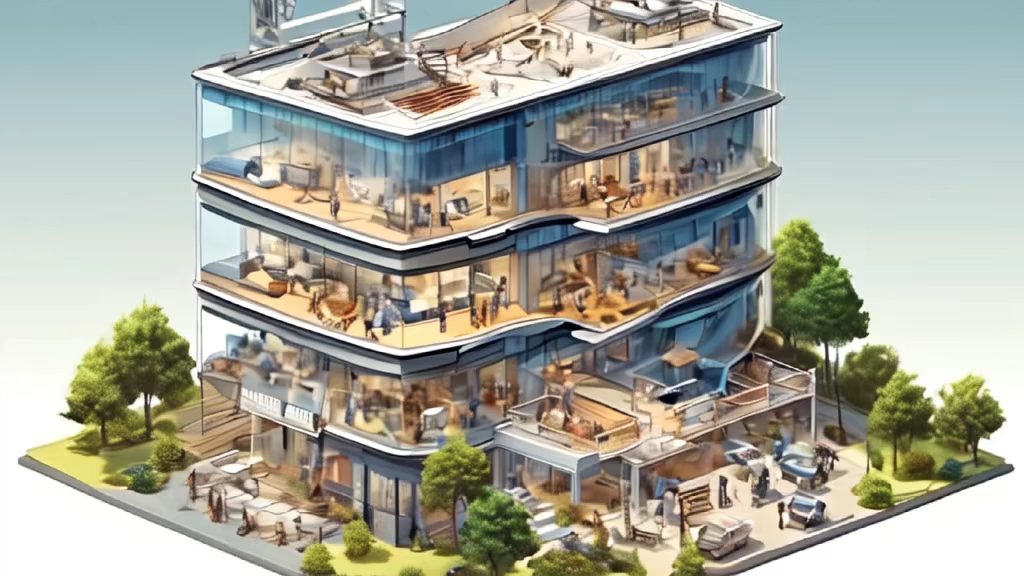
Prompt: Create an illustration of a building that's shot from isometric angle, the building contains a mechanical and carpentry workshop together and futuristic robotics tech laboratory separated from those two. Picture an anatomical view of the building.
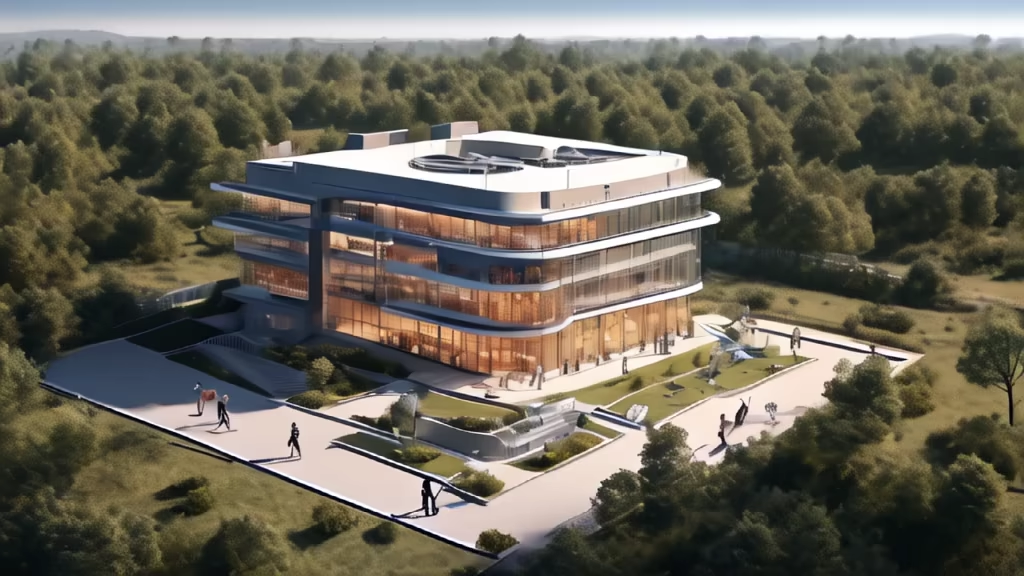
Prompt: Create a visually engaging collage for your \"AI + Technologies\" design concept with a central AI robotic image. Surround it with icons of diverse technologies, use flowing lines to represent data exchange, and incorporate human interaction visuals. Employ a cool color palette with metallic accents, and add text elements like \"Intelligent Connectivity.\" Experiment with layering for depth, integrate abstract patterns for a tech feel, and play with contrasts for visual impact. Include futuristic elements like holographic displays to emphasize innovation.


Prompt: Generate a promotional poster image, with blue as the main color, and some illusory backgrounds with a modern and technological feel. The transparency is below 30%, highlighting the theme of data intelligence, without small icon elements, introducing digital technology elements, and emphasizing numbers. For an ecological theme, don’t have concrete icons, 8k high definition.


Prompt: Generate a promotional poster image, with blue as the main color, and some illusory backgrounds with a modern and technological feel. The transparency is below 30%, highlighting the theme of data intelligence, without small icon elements, introducing digital technology elements, and emphasizing numbers. For an ecological theme, don’t have concrete icons, 8k high definition.


Prompt: dream prompt:create a visualization infographic to show opportunities and challenges of a low-carbon economy, data visualization, charts, graphs,pastel colors, high contrast


Prompt: A sleek, futuristic digital storage icon symbolizing efficiency and organization, with a constant flow of miniature game assets seamlessly entering a virtual realm. This icon showcases a stream of diverse content—icons, audio waves, and visual elements—merging into the storage, indicating minimal space consumption. The backdrop features a grid system, emphasizing organization, with assets interlocking to avoid duplication. This imagery captures the essence of a game's standardized content system, illustrating intelligent content addition and asset reuse, ensuring optimal disk space utilization.
Style: Pixel Art


Prompt: A detailed infographic showcasing Multi-Domain battlespaces would consist of a vertical depiction highlighting distinct horizontal segments. Starting from the top, a sleek digital interface symbolizes the 'cyber' domain with circuit patterns and data streams. Directly below, a stylized satellite and orbiting objects represent 'space'. 'Air' is depicted by jet fighters and aerial trails transitioning into 'surface' where tanks and troops appear. Further down, a naval ship denotes 'sea', while a tunnel entrance signifies 'underground'. Lastly, sonar waves and submarines symbolize the 'underwater' domain. Each segment is color-coded, ensuring a seamless transition between domains, making it visually comprehensive without textual distractions.


Prompt: create a visualization infographic to show opportunities and challenges of a low-carbon economy, charts, graphs, icons, modern design, pastel colors
Style: Digital Art



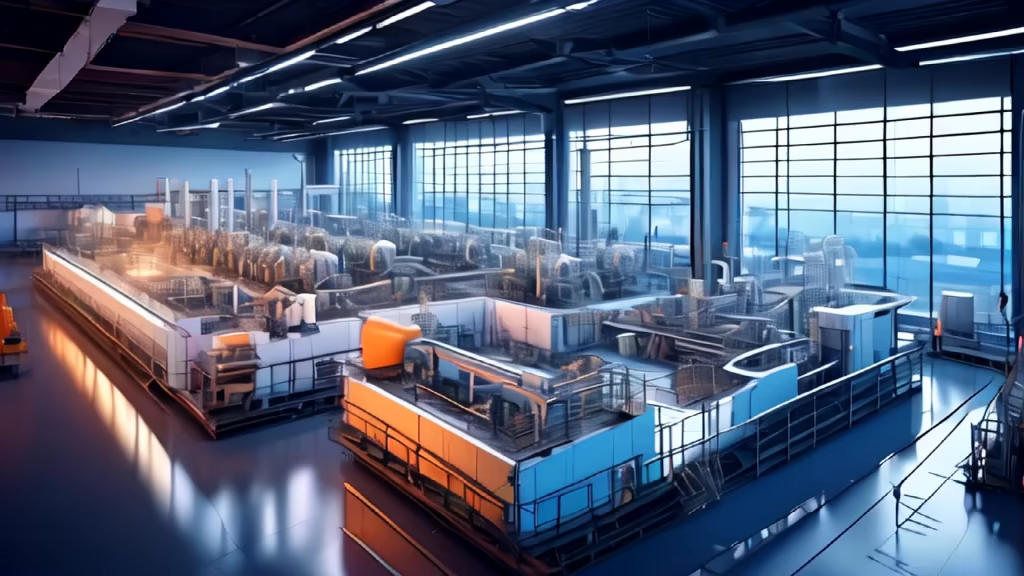
Prompt: Design of the first floor factory building The factory produces intelligent devices, storage equipment, shelves, isometric, pure black background, blue gradient polymethyl methacrylate and chromium, white chrome transparent technology, strong orange blue light, intelligent devices, ultra high quality, reduced details, 360 panoramic view, first person view, edge lights, ultra high definition, precise realism, rigorous lines, mixer, 3D art, OC renderer, soft lighting, 3D, UE5-ar 5:3-v 5-- S250

Prompt: target applications such as health care, material detection, sleeping monitoring, smart home automation, smart speaker control and presence detection.


Prompt: target applications such as health care, material detection, sleeping monitoring, smart home automation, smart speaker control and presence detection.


Prompt: Create a compelling image for a Climate Shelter and Community Center, providing protection from extreme weather conditions while autonomously regulating its climate through cleverly implemented, sustainable building techniques. Visualize innovative architectural elements centered around renewable energy sources, highlighting the integration of green technologies into the overall design. Emphasize in your image the social spaces and community facilities intended to strengthen the neighborhood. Consider the aesthetics and harmony between human and environment in your depiction.


Prompt: Technology visualization screen, city planning map, sense of technology, sense of the future


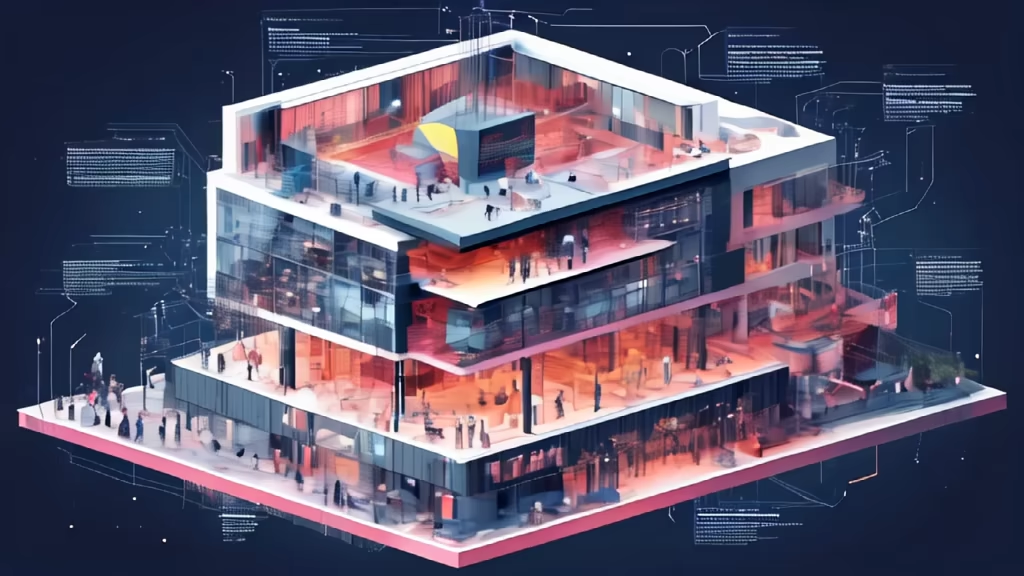
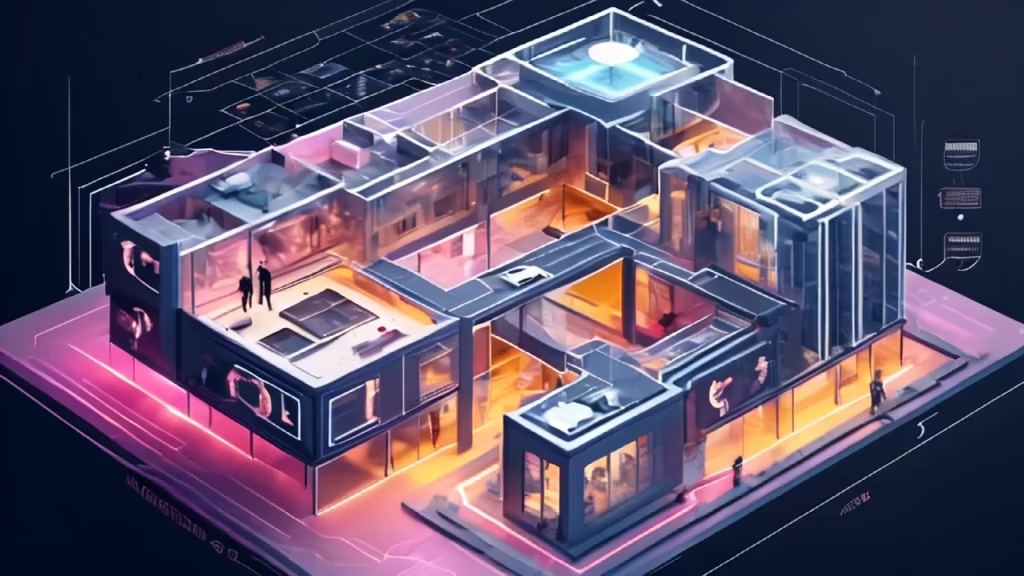
Prompt: dream prompt:create a visualization infographic to show opportunities and challenges of a low-carbon economy, data visualization, charts, graphs, icons,pastel colors,modern design

Prompt: Imagine an image showcasing a dynamic virtual landscape where interconnected gears symbolize the combined unified logistics and systems that revolutionize the organization of games. In the foreground, a vibrant metagame takes shape, represented by diverse game elements merging seamlessly. A central hub symbolizes the strategic orchestration of content, surrounded by paths illustrating the lifecycle and business model intricacies.


Prompt: \"Please help me create a framework diagram according to the following requirements.\"Create a machine learning model that can predict the average price of a house based on its features. The specific steps are as follows:Reading data in Python Defining problem statement Identifying target variable Checking the distribution of the target variable Basic Data Exploration Rejecting unnecessary columns Exploratory Data Analysis for data distribution (Histograms and Bar plots) Feature selection based on data distribution Outlier handling Missing value treatment Visual correlation analysis Statistical correlation analysis (Feature Selection) Converting data to numerical for ML Sampling and K-fold Cross Validation Trying multiple regression algorithms Choosing the best model Deploying the best model in production environment
