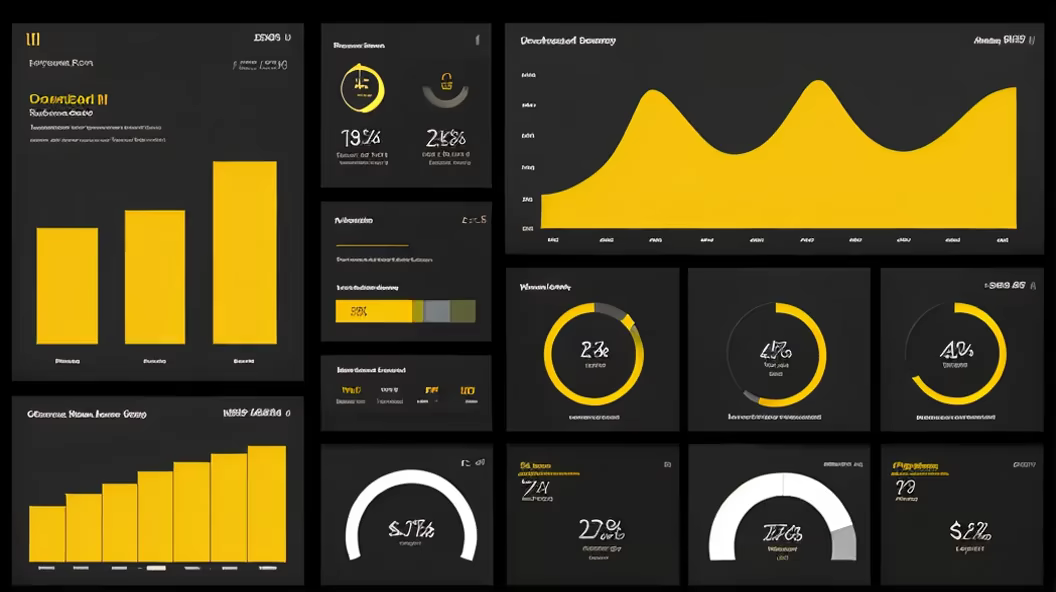
Prompt: \"Market Overview - Create an informative visual representation of a market overview. The image should convey key data, trends, and insights about a specific market or industry. Medium: Visual market overview representation. Style: Choose a style that communicates professionalism and data-driven insights. Resolution: High-quality to ensure clarity of data. --ar 16:9 --v 5.1 --style informative --q 2 --s 750.
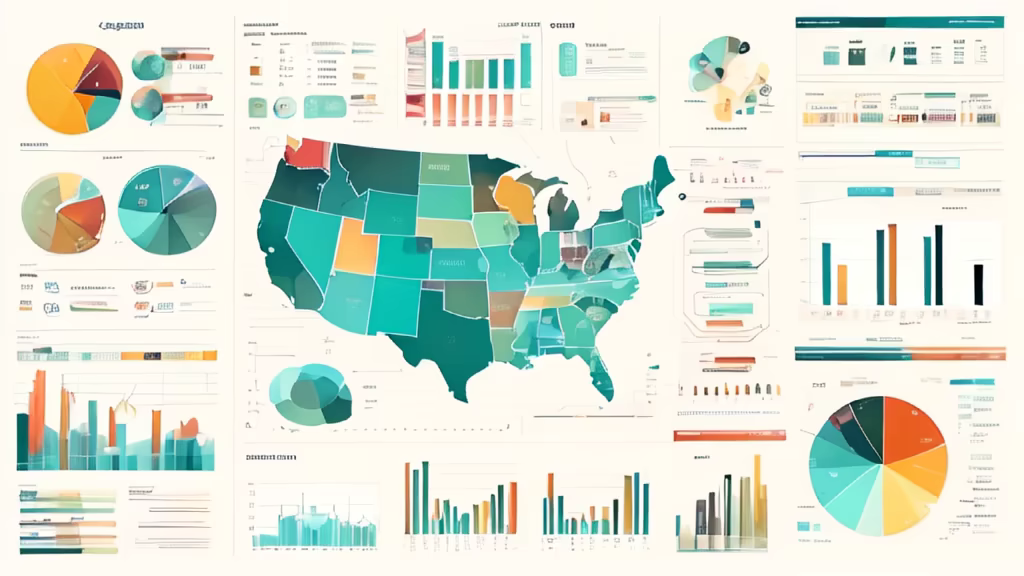
Prompt: \"Market Overview - Create an informative visual representation of a market overview. The image should convey key data, trends, and insights about a specific market or industry. Medium: Visual market overview representation. Style: Choose a style that communicates professionalism and data-driven insights. Resolution: High-quality to ensure clarity of data. --ar 16:9 --v 5.1 --style informative --q 2 --s 750.
Style: Watercolor


Prompt: Generate an image that visually represents the importance of diversifying a financial portfolio. The concept is that it's crucial not to put all your money in a single project. Some projects may not move at all, and money is always rotating. Use creative visuals to convey the idea of spreading investments across various assets for a well-balanced and resilient portfolio.


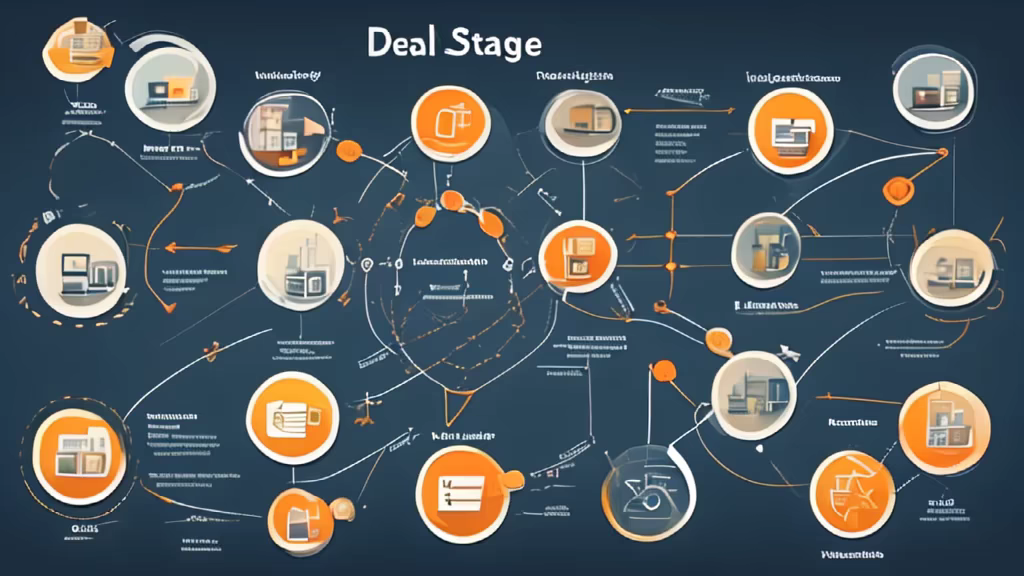
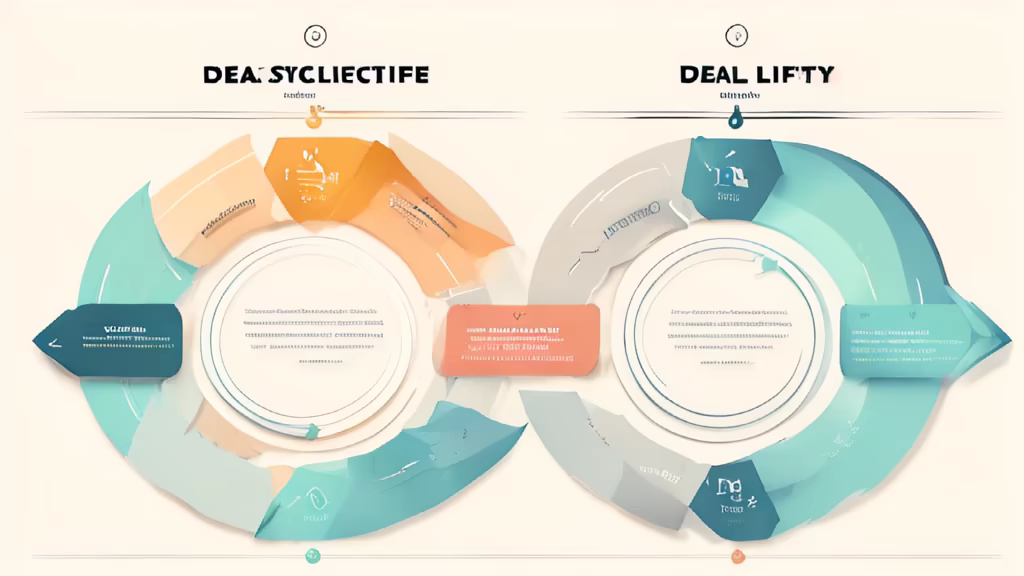
Prompt: Deal Lifecycle - Visualize the concept of a deal or transaction lifecycle. Represents the various stages and interactions within a deal, from initiation to completion. Medium: Visual representation of a deal's lifecycle. Style: Choose a style that conveys clarity and progression. Composition: Showcase the key stages and interactions in a clear and organized manner. Resolution: High-quality, emphasizing the details of each stage. --ar 16:9 --v 5.1 --style lifecycle --q 2 --s 750
Prompt: Generate a dashboard for Microsoft, highlighting revenue from different business segments and cloud services usage.\"


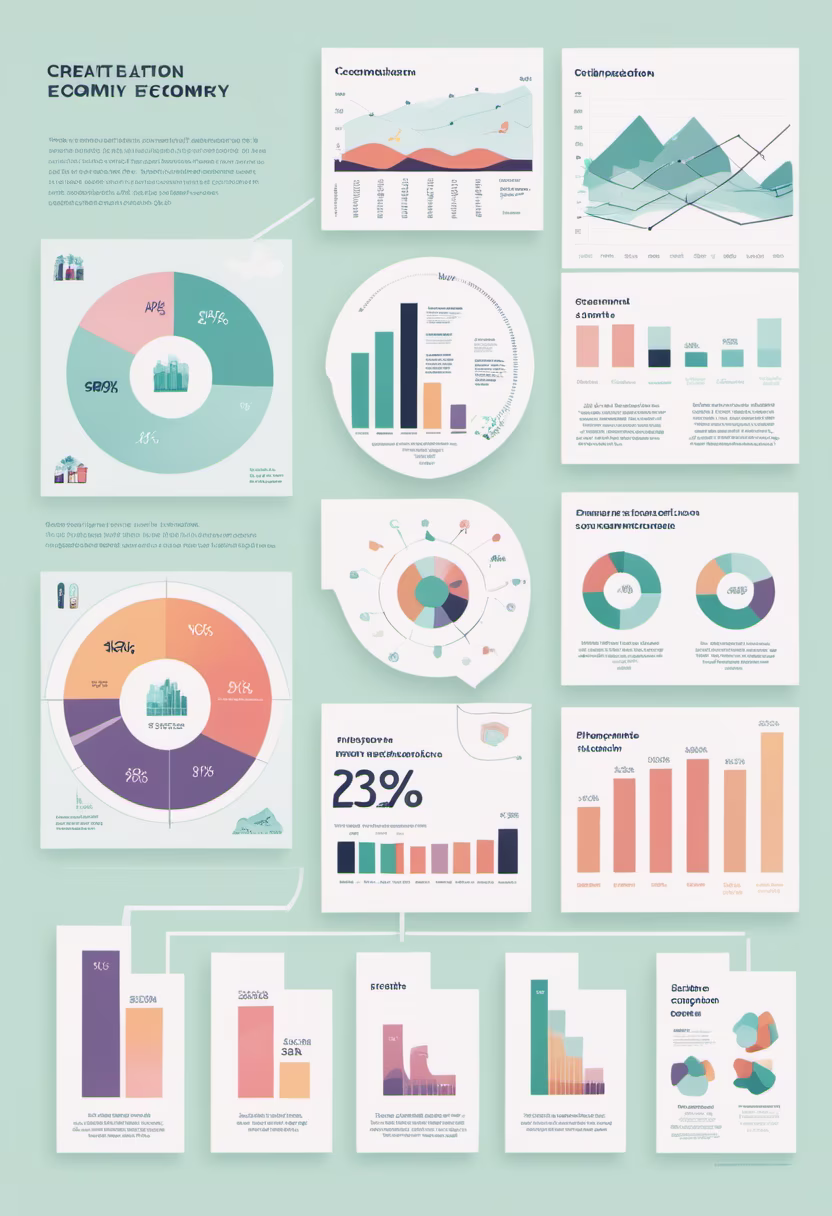
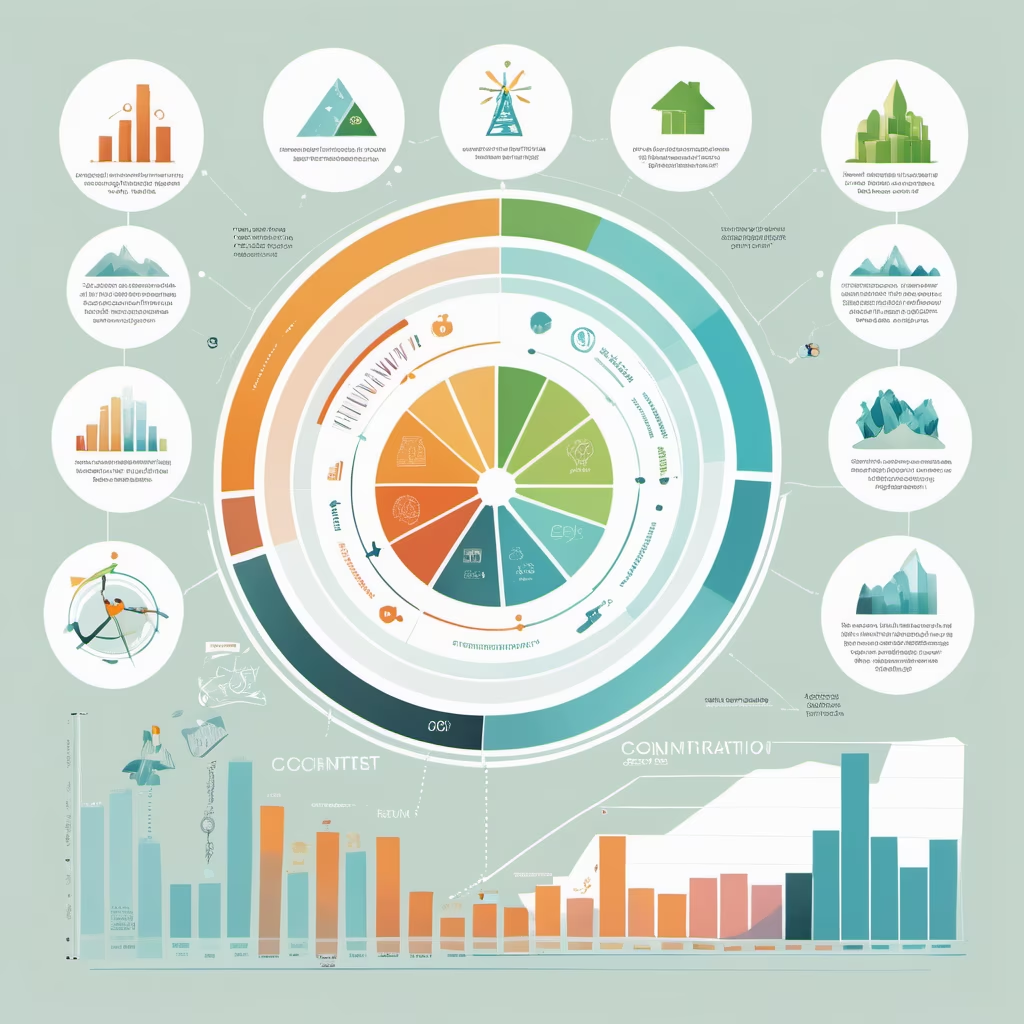
Prompt: dream prompt:create a visualization infographic to show opportunities and challenges of a low-carbon economy, data visualization, charts, graphs, modern design


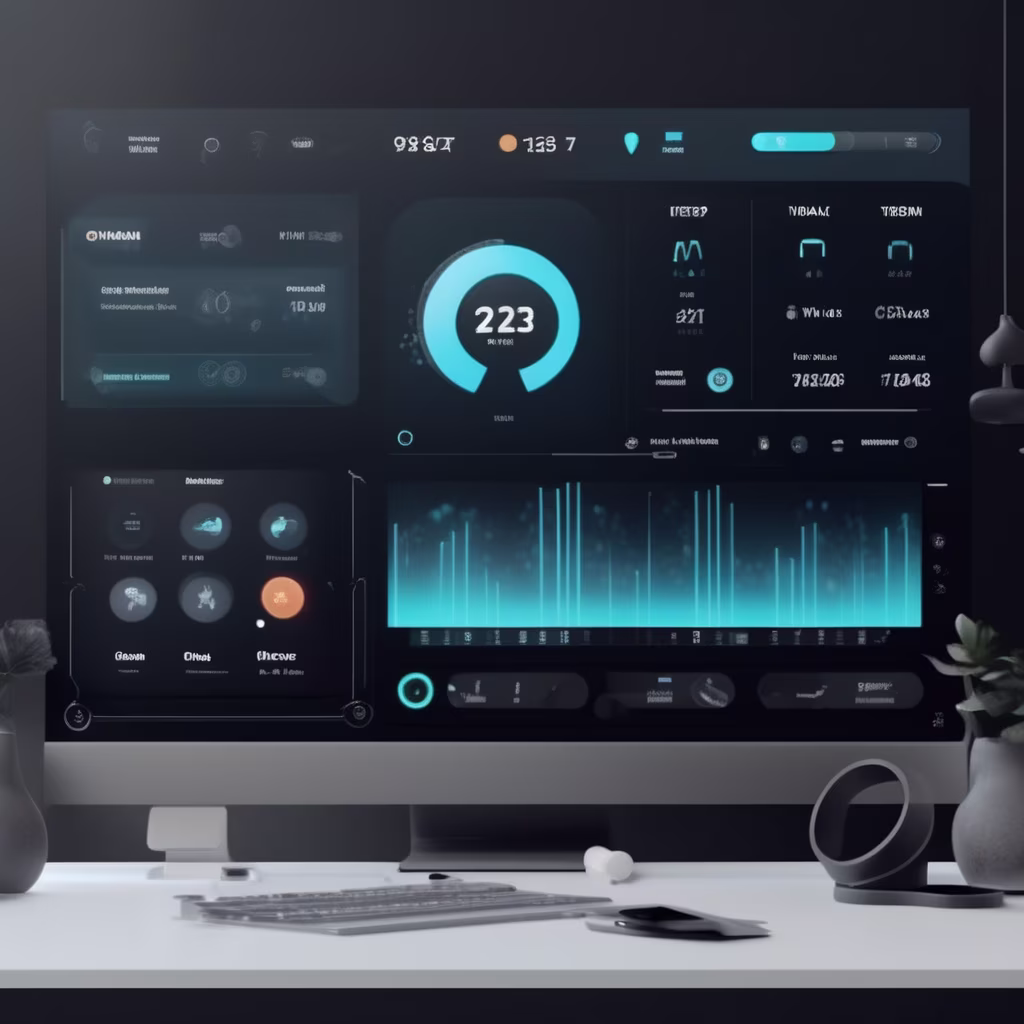
Prompt: Create a futuristic AI-driven dashboard for a smart home system that seamlessly integrates with Internet of Things (IoT) devices, focusing on a sleek and minimalist design with interactive data visualizations.


Prompt: The visuals evoke a sense of stretching the image. 3D screen interface, Deep blue data visualization, Dynamic 3D data display, Richly detailed information graphics, Immersive 3D data experience, Data-rich holographic screens, Deep blue knowledge projection, Comprehensive 3D data representation, Blue-hued interactive data screens, Information depth in 3D, Detailed data visualization on 3D screens, Interactive 3D information landscapes, Earth-centric 3D data models, Deep blue 3D data architecture, Celestial data insights on 3D screens, Advanced 3D data exploration, Blue spectrum 3D information retrieval, Enriched data presentation in 3D, Infinite depth 3D data ecosystem, Cutting-edge 3D knowledge display.


Prompt: This visual tool effectively communicates the importance of understanding the source and origin of advancements, encouraging a comprehensive comprehension of the journey leading to the final technological outcome.


Prompt: create a visualization infographic to show opportunities and challenges of a low-carbon economy, data visualization, charts, graphs, high contrast, light background


Prompt: A cutting-edge software interface displaying medical data exploration. The focal point is a dynamic display of patient information with interactive features, cg, high-tech, sleek, user-friendly, interactive, illuminated, transparent overlays, holographic elements.


Prompt: Generate a user interface design for a portfolio website that embodies a clean and detailed aesthetic. Consider incorporating modern design elements, intuitive navigation, and visually appealing graphics to enhance the overall user experience. Provide a desktop and mobile version to ensure a seamless transition between devices. Focus on showcasing the individual's skills and achievements in a visually compelling manner while maintaining a minimalist and professional look


Prompt: create a simple, colorful data visualization graphic to visualize two data points: (1) 100+ building facilities (2) 10 million+ sq ft of building space.


Prompt: dream prompt:create a visualization infographic to show opportunities and challenges of a low-carbon economy, data visualization, charts, graphs,pastel colors, high contrast

Prompt: Visualize a cityscape from a bird’s eye view, showcasing the city’s architectural diversity and urban layout. The image should capture the city’s sprawling expanse, the variety of buildings, and the intricate network of streets. Use a high-resolution 16k camera with a 16:9 aspect ratio, a raw style, and a quality setting of 2 to capture this panoramic view. –ar 16:9 –v 5.2 –style raw –q 2 –s 750


Prompt: Visualize a cityscape from a bird’s eye view, showcasing the city’s architectural diversity and urban layout. The image should capture the city’s sprawling expanse, the variety of buildings, and the intricate network of streets. Use a high-resolution 16k camera with a 16:9 aspect ratio, a raw style, and a quality setting of 2 to capture this panoramic view. –ar 16:9 –v 5.2 –style raw –q 2 –s 750


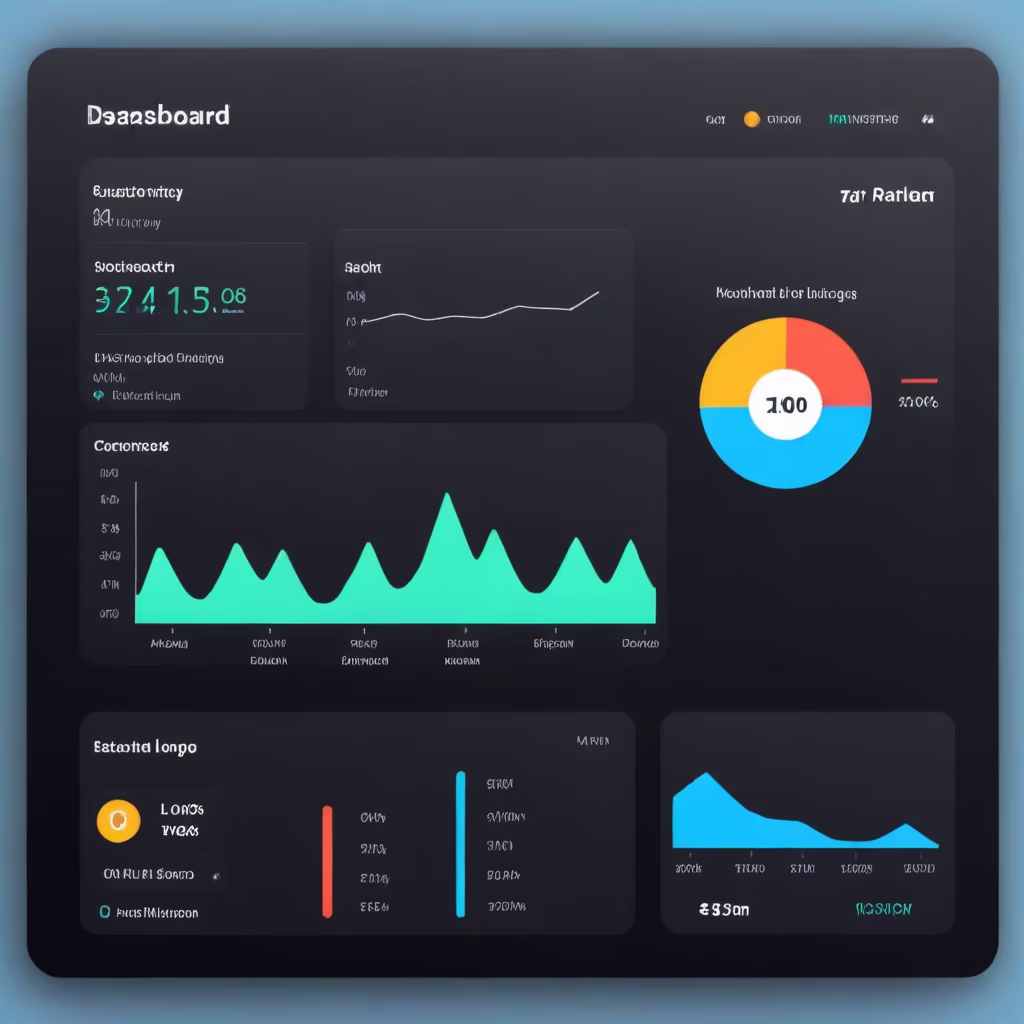
Prompt: create a dashboard for portfolio details page with most useful kpis. In this page we will displaying the list of stocks that are added to the portfolio


Prompt: Generate an image showcasing the dynamic talent acquisition cycle in the oil and gas industry. Visualize the stages, from workforce planning and job role definition to recruitment strategy and candidate onboarding. Feature diverse professionals engaged in technical interviews, negotiations, and onboarding sessions. Highlight the integration of cutting-edge technology and industry-specific tools. Capture the essence of a vibrant and evolving talent ecosystem within the oil and gas sector, emphasizing the importance of skilled professionals in driving success and innovation


Prompt: Visualize the key characters huddled in a war room, maps and battle plans spread out before them. Capture the intensity of the strategic discussions and decision-making during the mid-journey.


Prompt: Graphic displaying financial data analysis with AI, AI-powered banking or fintech apps, or professionals working in the finance sector with AI technologies.


Prompt: In this vast realm of AI, envision every industry as a vibrant canvas, and AI tools as brushes transcending boundaries. In healthcare, they serve as precise diagnostic instruments, aiding physicians in accurate disease assessment through data analysis and image recognition.


Prompt: In this vast realm of AI, envision every industry as a vibrant canvas, and AI tools as brushes transcending boundaries. In healthcare, they serve as precise diagnostic instruments, aiding physicians in accurate disease assessment through data analysis and image recognition.


Prompt: create a visualization infographic to show opportunities and challenges of a low-carbon economy, data visualization, charts, graphs, icons,pastel colors,modern design


Prompt: dream prompt:create a visualization infographic to show opportunities and challenges of a low-carbon economy, data visualization, charts, graphs, icons,pastel colors,modern design

Prompt: Create a captivating educational image targeting individuals who want to learn the art and strategies of forex trading from the ground up. The design should focus on providing a comprehensive understanding of the basics and fundamental concepts of the forex market, emphasizing how to read charts, comprehend economic news, and analyze trends. The design should be inspirational and motivational, incorporating charts and illustrative images to guide students step by step through forex concepts. Ensure that the design elements reflect the essence of the educational course and how participants can start their trading journey with confidence and understanding. The design should also encourage interaction and participation by including questions and challenges to ensure effective engagement and stimulate deep content comprehension

Prompt: Create a captivating educational image targeting individuals who want to learn the art and strategies of forex trading from the ground up. The design should focus on providing a comprehensive understanding of the basics and fundamental concepts of the forex market, emphasizing how to read charts, comprehend economic news, and analyze trends. The design should be inspirational and motivational, incorporating charts and illustrative images to guide students step by step through forex concepts. Ensure that the design elements reflect the essence of the educational course and how participants can start their trading journey with confidence and understanding. The design should also encourage interaction and participation by including questions and challenges to ensure effective engagement and stimulate deep content comprehension.


Prompt: Create a captivating educational image targeting individuals who want to learn the art and strategies of forex trading from the ground up. The design should focus on providing a comprehensive understanding of the basics and fundamental concepts of the forex market, emphasizing how to read charts, comprehend economic news, and analyze trends. The design should be inspirational and motivational, incorporating charts and illustrative images to guide students step by step through forex concepts. Ensure that the design elements reflect the essence of the educational course and how participants can start their trading journey with confidence and understanding. The design should also encourage interaction and participation by including questions and challenges to ensure effective engagement and stimulate deep content comprehension.


Prompt: 3D screen interface, Deep blue data visualization, Dynamic 3D data display, Richly detailed information graphics, Immersive 3D data experience, Data-rich holographic screens, Deep blue knowledge projection, Comprehensive 3D data representation, Blue-hued interactive data screens, Information depth in 3D, Detailed data visualization on 3D screens, Interactive 3D information landscapes, Earth-centric 3D data models, Deep blue 3D data architecture, Celestial data insights on 3D screens, Advanced 3D data exploration, Blue spectrum 3D information retrieval, Enriched data presentation in 3D, Infinite depth 3D data ecosystem, Cutting-edge 3D knowledge display.


Prompt: create a visualization infographic to show opportunities and challenges of a low-carbon economy, data visualization, charts, graphs, high contrast, blue and green, white background


Prompt: Create a captivating educational image targeting individuals who want to learn the art and strategies of forex trading from the ground up. The design should focus on providing a comprehensive understanding of the basics and fundamental concepts of the forex market, emphasizing how to read charts, comprehend economic news, and analyze trends. The design should be inspirational and motivational, incorporating charts and illustrative images to guide students step by step through forex concepts. Ensure that the design elements reflect the essence of the educational course and how participants can start their trading journey with confidence and understanding. The design should also encourage interaction and participation by including questions and challenges to ensure effective engagement and stimulate deep content comprehension,blue colour , faceless
Style: Digital Art


Prompt: Create a captivating educational image targeting individuals who want to learn the art and strategies of forex trading from the ground up. The design should focus on providing a comprehensive understanding of the basics and fundamental concepts of the forex market, emphasizing how to read charts, comprehend economic news, and analyze trends. The design should be inspirational and motivational, incorporating charts and illustrative images to guide students step by step through forex concepts. Ensure that the design elements reflect the essence of the educational course and how participants can start their trading journey with confidence and understanding. The design should also encourage interaction and participation by including questions and challenges to ensure effective engagement and stimulate deep content comprehension. blue coluor
Style: Digital Art


Prompt: create a visualization infographic to show opportunities and challenges of a low-carbon economy, charts, graphs, icons, modern design


Prompt: dream prompt:create a visualization infographic to show opportunities and challenges of a low-carbon economy, data visualization, charts, graphs,pastel colors,modern design


Prompt: create a visualization infographic to show opportunities and challenges of a low-carbon economy, charts, graphs, icons, modern design, pastel colors
Style: Digital Art


Prompt: Design a web page interface where users can seamlessly choose between two services - one tailored for professionals and the other for individuals. Create an intuitive layout with clear sections for each category. Utilize a harmonious color scheme, modern typography, and interactive elements to enhance the user experience. Ensure the design is visually appealing and user-friendly


Prompt: Generate an abstract design with vibrant and modern colors. The design should reflect an unique identity. Use abstract shapes, dynamic patterns, and a color palette that conveys creativity and innovation.


Prompt: Data Visualization, Clean Background, Blue, Single Subject, 3D Model, Minimalist Design, Clarity, Graphical Representation, Visual Data, Information Display, Modern Aesthetics, Simplicity, Elegant Design, Technological Sophistication, Depth Perception, Dynamic Visuals, Vivid Colors, Spatial Arrangement, Digital Transformation, Futuristic Elements


Prompt: Data repositories, knowledge graph, semantic indexing, blue data visualization, information architecture, comprehensive datasets, deep learning analytics, cognitive computing, domain-specific insights, ontology mapping, structured knowledge, interconnected data nodes, blue-themed data mining, in-depth data curation, contextual data representation, graph-based knowledge storage, comprehensive data catalog, blue spectrum information retrieval, robust data ecosystem, knowledge enrichment.


Prompt: Data repositories, knowledge graph, semantic indexing, blue data visualization, information architecture, comprehensive datasets, deep learning analytics, cognitive computing, domain-specific insights, ontology mapping, structured knowledge, interconnected data nodes, blue-themed data mining, in-depth data curation, contextual data representation, graph-based knowledge storage, comprehensive data catalog, blue spectrum information retrieval, robust data ecosystem, knowledge enrichment.


Prompt: Data repositories, knowledge graph, semantic indexing, blue data visualization, information architecture, comprehensive datasets, deep learning analytics, cognitive computing, domain-specific insights, ontology mapping, structured knowledge, interconnected data nodes, blue-themed data mining, in-depth data curation, contextual data representation, graph-based knowledge storage, comprehensive data catalog, blue spectrum information retrieval, robust data ecosystem, knowledge enrichment.


Prompt: Visualize symbolic representations of battles, both internal and external, flashing across the screen


Prompt: create a visualization infographic to show opportunities and challenges of a low-carbon economy, data visualization, charts, graphs, high contrast, blue and green, light background

Prompt: Regularly assess the generated artworks for biases and fine-tune the model based on feedback. Implement ongoing monitoring to detect and correct biases as they emerge.
Style: Isometric


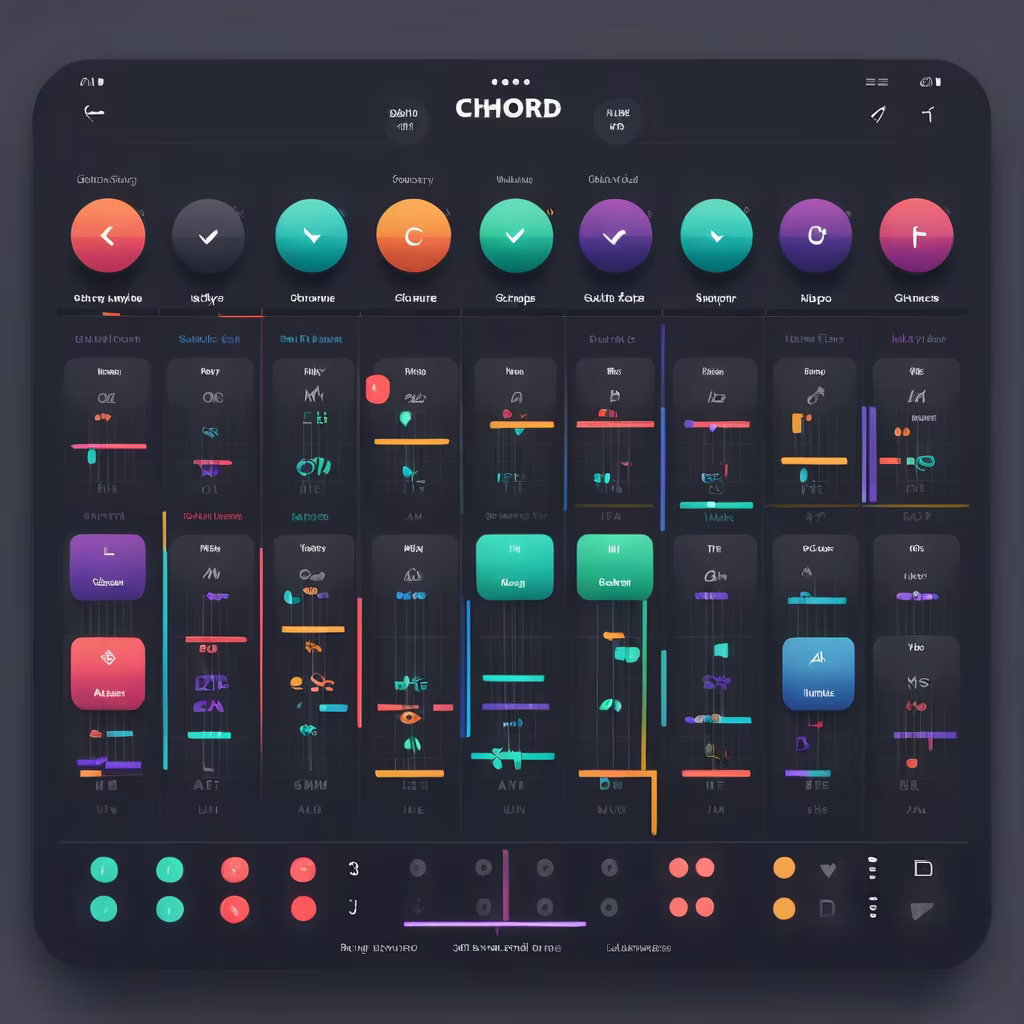
Prompt: Design a simple home screen that displays all the chord charts, sorted by note or chord type. Use intuitive ICONS or colors to enable users to quickly find chords they are interested in